

Question: Coffee/Tea Canned Snacks & Candy Fall Other 2 $ $ $ $ 2009 3,136.48 (1,874.29) 1,262.19 (750.00) (250.00) Spring 2010 3,250.97 (1,760.43) 1,490.54 (750.00) (250.00)
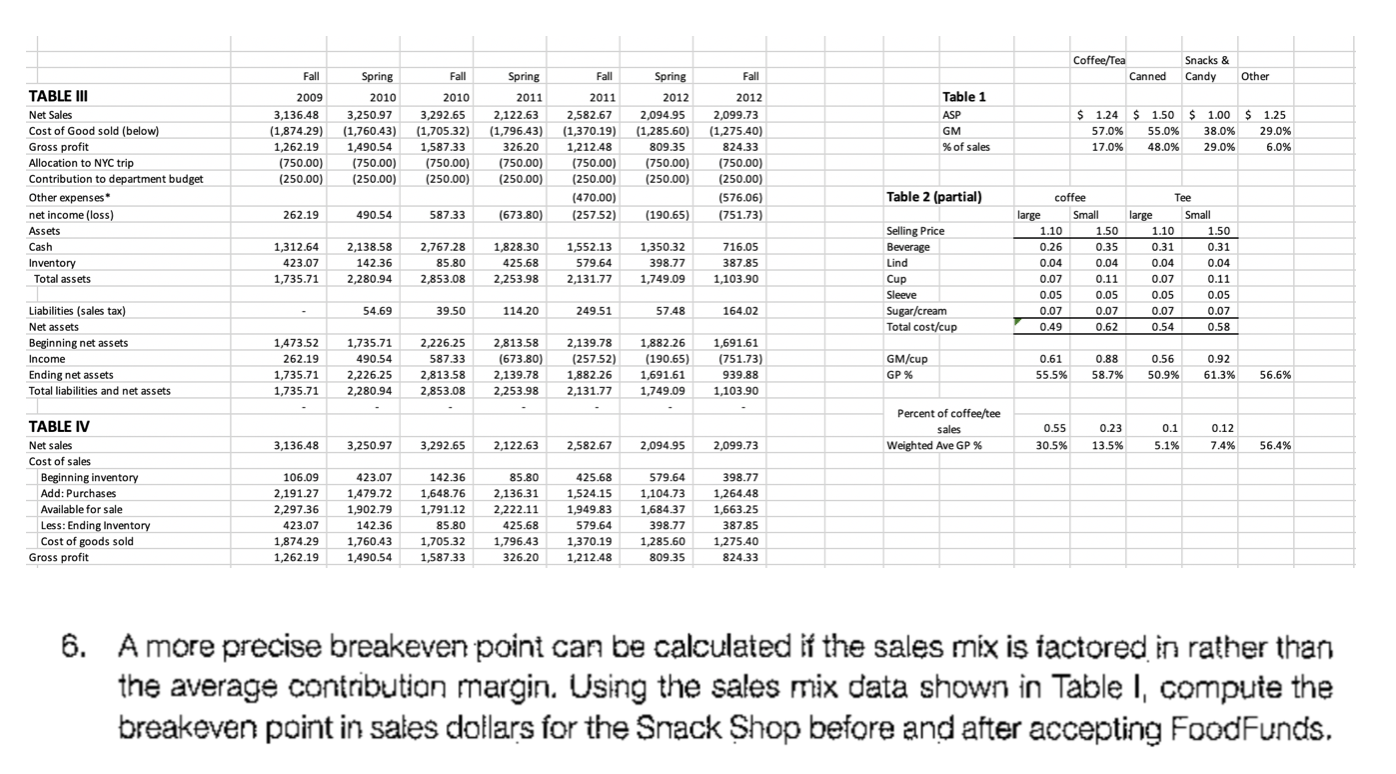
Coffee/Tea Canned Snacks & Candy Fall Other 2 $ $ $ $ 2009 3,136.48 (1,874.29) 1,262.19 (750.00) (250.00) Spring 2010 3,250.97 (1,760.43) 1,490.54 (750.00) (250.00) Fall 2010 3,292.65 (1,705.32) 1,587.33 (750.00) (250.00) Table 1 ASP GM % of sales Spring 2011 2,122.63 (1,796.43) 326.20 (750.00) (250.00) Fall 2011 2,582.67 (1,370.19) 1,212.48 (750.00) (250.00) (470.00) (257.52) TABLE III Net Sales Cost of Good sold (below) Gross profit Allocation to NYC trip Contribution to department budget Other expenses net income (loss) Assets Cash Inventory Total assets Spring 2012 ,094.95 (1,285.60) 809.35 (750.00) (250.00) Fall 2012 2,099.73 (1,275.40) 824.33 (750.00) (250.00) (576.06) (751.73) 1.24 57.0% 17.0% 1.50 55.0% 48.0% 1.00 38.0% 29.0% 1.25 29.0% 6.0% Table 2 (partial) 262.19 490.54 587.33 (673.80) (190.65) 1,312.64 423.07 1,735.71 2,138.58 142.36 2,280.94 2,767.28 85.80 2,853.08 1,828.30 425.68 2,253.98 1,552.13 579.64 2,131.77 1,350.32 3 98.77 1,749.09 716.05 387.85 1,103.90 Selling Price Beverage Lind Cup Sleeve Sugar/cream Total cost/cup coffee large Small 1.10 1.50 0.26 0.35 0.04 0.04 0.07 0.11 0.05 0.05 0.07 0.07 0.49 0.62 Tee large Small 1.10 1.50 0.31 0.31 0.04 0.04 0.07 0.11 0.05 0.05 0.07 0.07 0.54 0.58 54.69 39.50 114.20 2 49.51 57.48 164.02 Liabilities (sales tax) Net assets Beginning net assets Income Ending net assets Total liabilities and net assets 1,473.52 262.19 1,735.71 1,735.71 1,735.71 490.54 2,226.25 2,280.94 2,226.25 587.33 2,813.58 2,853.08 2,813.58 (673.80) 2,139.78 2,253.98 2,139.78 (257.52) 1,882.26 2,131.77 1,882.26 (190.65) 1,691.61 1 1,749.09 1,691.61 (751.73) 939.88 1,103.90 GM/cup GP % 0.61 55.5% 0.88 58.7% 0.56 50.9% 0.92 61.3% 56.6% Percent of coffee/tee sales Weighted Ave GP % 0.55 30.5% 0.23 13.5% 0.1 5.1% 0.12 7.4% 3,136.48 3,250.97 3,292.65 2,122.63 2,582.67 2,094.95 2,099.73 56.4% TABLE IV Net sales Cost of sales Beginning inventory Add: Purchases Available for sale Less: Ending Inventory Cost of goods sold Gross profit 1 106.09 2,191.27 2,297.36 423.07 1,874.29 1,262.19 423.07 1,479.72 1,902.79 142.36 1,760.43 1,490.54 142.36 1,648.76 1,791.12 1.791.12 85.80 1,705.32 1,587.33 85.80 2,136.31 2222 11 2,222.11 425.68 1,796.43 326.20 425.68 1,524.15 ,949.83 579.64 1,370.19 1,212.48 579.64 1,104.73 1,684.37 398.77 1,285.60 809.35 398.77 1,264.48 1663 25 387.85 1,275.40 824.33 Amore precise breakeven point can be calculated if the sales mix i factored in rather than the average contribution margin. Using the sales mix data shown in Table I, compute the breakeven point in sales dollars for the Snack Shop before and after accepting FoodFunds. Coffee/Tea Canned Snacks & Candy Fall Other 2 $ $ $ $ 2009 3,136.48 (1,874.29) 1,262.19 (750.00) (250.00) Spring 2010 3,250.97 (1,760.43) 1,490.54 (750.00) (250.00) Fall 2010 3,292.65 (1,705.32) 1,587.33 (750.00) (250.00) Table 1 ASP GM % of sales Spring 2011 2,122.63 (1,796.43) 326.20 (750.00) (250.00) Fall 2011 2,582.67 (1,370.19) 1,212.48 (750.00) (250.00) (470.00) (257.52) TABLE III Net Sales Cost of Good sold (below) Gross profit Allocation to NYC trip Contribution to department budget Other expenses net income (loss) Assets Cash Inventory Total assets Spring 2012 ,094.95 (1,285.60) 809.35 (750.00) (250.00) Fall 2012 2,099.73 (1,275.40) 824.33 (750.00) (250.00) (576.06) (751.73) 1.24 57.0% 17.0% 1.50 55.0% 48.0% 1.00 38.0% 29.0% 1.25 29.0% 6.0% Table 2 (partial) 262.19 490.54 587.33 (673.80) (190.65) 1,312.64 423.07 1,735.71 2,138.58 142.36 2,280.94 2,767.28 85.80 2,853.08 1,828.30 425.68 2,253.98 1,552.13 579.64 2,131.77 1,350.32 3 98.77 1,749.09 716.05 387.85 1,103.90 Selling Price Beverage Lind Cup Sleeve Sugar/cream Total cost/cup coffee large Small 1.10 1.50 0.26 0.35 0.04 0.04 0.07 0.11 0.05 0.05 0.07 0.07 0.49 0.62 Tee large Small 1.10 1.50 0.31 0.31 0.04 0.04 0.07 0.11 0.05 0.05 0.07 0.07 0.54 0.58 54.69 39.50 114.20 2 49.51 57.48 164.02 Liabilities (sales tax) Net assets Beginning net assets Income Ending net assets Total liabilities and net assets 1,473.52 262.19 1,735.71 1,735.71 1,735.71 490.54 2,226.25 2,280.94 2,226.25 587.33 2,813.58 2,853.08 2,813.58 (673.80) 2,139.78 2,253.98 2,139.78 (257.52) 1,882.26 2,131.77 1,882.26 (190.65) 1,691.61 1 1,749.09 1,691.61 (751.73) 939.88 1,103.90 GM/cup GP % 0.61 55.5% 0.88 58.7% 0.56 50.9% 0.92 61.3% 56.6% Percent of coffee/tee sales Weighted Ave GP % 0.55 30.5% 0.23 13.5% 0.1 5.1% 0.12 7.4% 3,136.48 3,250.97 3,292.65 2,122.63 2,582.67 2,094.95 2,099.73 56.4% TABLE IV Net sales Cost of sales Beginning inventory Add: Purchases Available for sale Less: Ending Inventory Cost of goods sold Gross profit 1 106.09 2,191.27 2,297.36 423.07 1,874.29 1,262.19 423.07 1,479.72 1,902.79 142.36 1,760.43 1,490.54 142.36 1,648.76 1,791.12 1.791.12 85.80 1,705.32 1,587.33 85.80 2,136.31 2222 11 2,222.11 425.68 1,796.43 326.20 425.68 1,524.15 ,949.83 579.64 1,370.19 1,212.48 579.64 1,104.73 1,684.37 398.77 1,285.60 809.35 398.77 1,264.48 1663 25 387.85 1,275.40 824.33 Amore precise breakeven point can be calculated if the sales mix i factored in rather than the average contribution margin. Using the sales mix data shown in Table I, compute the breakeven point in sales dollars for the Snack Shop before and after accepting FoodFunds
Step by Step Solution
There are 3 Steps involved in it

Get step-by-step solutions from verified subject matter experts