

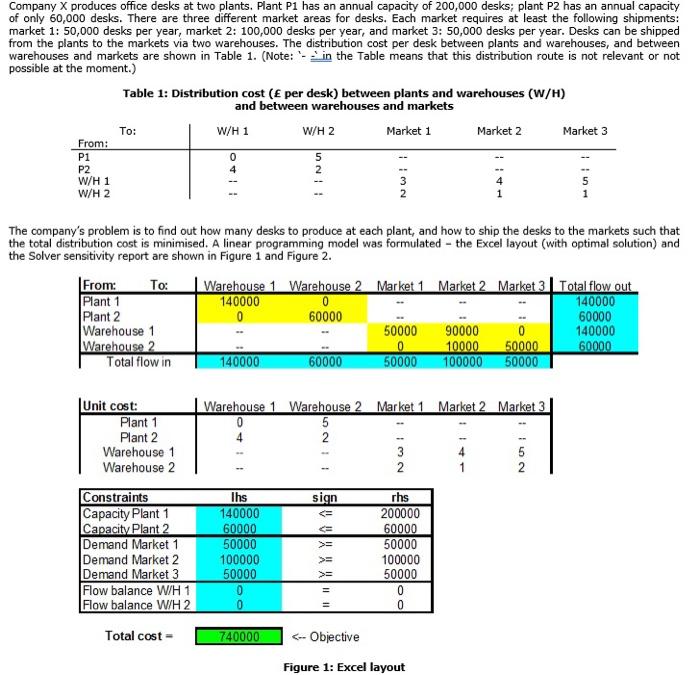
Company X produces office desks at two plants. Plant P1 has an annual capacity of 200,000...
Fantastic news! We've Found the answer you've been seeking!
Question:
Transcribed Image Text:
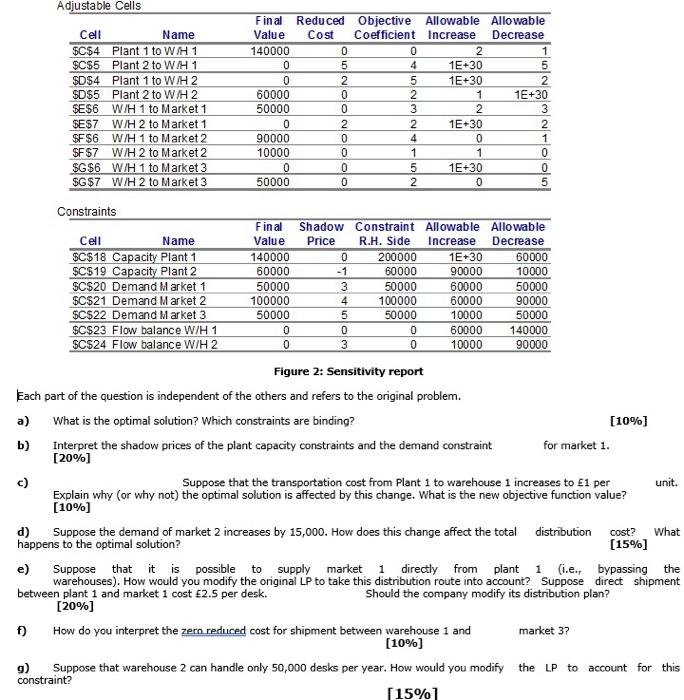
Company X produces office desks at two plants. Plant P1 has an annual capacity of 200,000 desks; plant P2 has an annual capacity of only 60,000 desks. There are three different market areas for desks. Each market requires at least the following shipments: market 1: 50,000 desks per year, market 2: 100,000 desks per year, and market 3: 50,000 desks per year. Desks can be shipped from the plants to the markets via two warehouses. The distribution cost per desk between plants and warehouses, and between warehouses and markets are shown in Table 1. (Note: in the Table means that this distribution route is not relevant or not possible at the moment.) Table 1: Distribution cost ( per desk) between plants and warehouses (W/H) and between warehouses and markets To: From: P1 P2 W/H 1 W/H 2 W/H 1 W/H 2 521 Market 1 Market 2 Market 3 51 The company's problem is to find out how many desks to produce at each plant, and how to ship the desks to the markets such that the total distribution cost is minimised. A linear programming model was formulated the Excel layout (with optimal solution) and the Solver sensitivity report are shown in Figure 1 and Figure 2. From: Plant 1 To: Warehouse 1 Warehouse 2 Market 1 Market 2 Market 3 Total flow out 140000 0 140000 Plant 2 0 60000 60000 Warehouse 1 50000 90000 140000 Warehouse 2 0 10000 50000 60000 Total flow in 140000 60000 50000 100000 50000 Unit cost: Plant 1 Warehouse 1 Warehouse 2 Market 1 Market 2 Market 3 0 Plant 2 4 Warehouse 1 Warehouse 2 5 2 TINGE - 132 1162 5 Constraints Ihs sign rhs Capacity Plant 1 140000 200000 Capacity Plant 2 60000 60000 Demand Market 1 50000 Demand Market 2 100000 Demand Market 3 50000 = < Flow balance W/H 1 Flow balance W/H 2 0 50000 100000 50000 0 0 Total cost- 740000 140000 0 0 60000 50000 0 W/H 1 to Market 2 90000 W/H 2 to Market 2 10000 Adjustable Cells Cell Name $C$4 Plant 1 to W/H 1 $C$5 Plant 2 to W/H 1 $D$4 Plant 1 to W/H2 $D$5 Plant 2 to W/H 2 $E$6 W/H 1 to Market 1 SE$7 W/H 2 to Market 1 $F$6 SF $7 Final Reduced Objective Allowable Allowable Value Cost Coefficient Increase Decrease 0 0 2 1 5 4 1E+30 5 2 5 1E+30 2 0 2 1 1E+30 0 3 2 3 2 2 1E+30 2 0 4 0 1 0 1 1 0 $G$6 W/H 1 to Market 3 0 0 5 1E+30 0 $G$7 W/H 2 to Market 3 50000 0 2 0 5 Constraints Final Shadow Constraint Allowable Allowable Cell Name Value Price R.H. Side Increase Decrease $C$18 Capacity Plant 1 140000 0 200000 1E+30 60000 $C$19 Capacity Plant 2 60000 -1 60000 90000 10000 $C$20 Demand Market 1 50000 3 50000 60000 50000 $C$21 Demand Market 2 100000 4 100000 60000 90000 $C$22 Demand Market 3 50000 5 50000 10000 50000 $C$23 Flow balance W/H 1 0 0 0 60000 140000 $C$24 Flow balance W/H 2 0 3 0 10000 90000 Figure 2: Sensitivity report Each part of the question is independent of the others and refers to the original problem. a) What is the optimal solution? Which constraints are binding? b) Interpret the shadow prices of the plant capacity constraints and the demand constraint [20%] [10%] for market 1. c) Suppose that the transportation cost from Plant 1 to warehouse 1 increases to 1 per Explain why (or why not) the optimal solution is affected by this change. What is the new objective function value? [10%] unit. d) Suppose the demand of market 2 increases by 15,000. How does this change affect the total distribution happens to the optimal solution? cost? What [15%] bypassing the e) Suppose that it is possible to supply market 1 directly from plant 1 (i.e., warehouses). How would you modify the original LP to take this distribution route into account? Suppose direct shipment. between plant 1 and market 1 cost 2.5 per desk. Should the company modify its distribution plan? f) g) [20%] How do you interpret the zern reduced cost for shipment between warehouse 1 and [10%] market 3? Suppose that warehouse 2 can handle only 50,000 desks per year. How would you modify the LP to account for this constraint? [15%] Company X produces office desks at two plants. Plant P1 has an annual capacity of 200,000 desks; plant P2 has an annual capacity of only 60,000 desks. There are three different market areas for desks. Each market requires at least the following shipments: market 1: 50,000 desks per year, market 2: 100,000 desks per year, and market 3: 50,000 desks per year. Desks can be shipped from the plants to the markets via two warehouses. The distribution cost per desk between plants and warehouses, and between warehouses and markets are shown in Table 1. (Note: in the Table means that this distribution route is not relevant or not possible at the moment.) Table 1: Distribution cost ( per desk) between plants and warehouses (W/H) and between warehouses and markets To: From: P1 P2 W/H 1 W/H 2 W/H 1 W/H 2 521 Market 1 Market 2 Market 3 51 The company's problem is to find out how many desks to produce at each plant, and how to ship the desks to the markets such that the total distribution cost is minimised. A linear programming model was formulated the Excel layout (with optimal solution) and the Solver sensitivity report are shown in Figure 1 and Figure 2. From: Plant 1 To: Warehouse 1 Warehouse 2 Market 1 Market 2 Market 3 Total flow out 140000 0 140000 Plant 2 0 60000 60000 Warehouse 1 50000 90000 140000 Warehouse 2 0 10000 50000 60000 Total flow in 140000 60000 50000 100000 50000 Unit cost: Plant 1 Warehouse 1 Warehouse 2 Market 1 Market 2 Market 3 0 Plant 2 4 Warehouse 1 Warehouse 2 5 2 TINGE - 132 1162 5 Constraints Ihs sign rhs Capacity Plant 1 140000 200000 Capacity Plant 2 60000 60000 Demand Market 1 50000 Demand Market 2 100000 Demand Market 3 50000 = < Flow balance W/H 1 Flow balance W/H 2 0 50000 100000 50000 0 0 Total cost- 740000 140000 0 0 60000 50000 0 W/H 1 to Market 2 90000 W/H 2 to Market 2 10000 Adjustable Cells Cell Name $C$4 Plant 1 to W/H 1 $C$5 Plant 2 to W/H 1 $D$4 Plant 1 to W/H2 $D$5 Plant 2 to W/H 2 $E$6 W/H 1 to Market 1 SE$7 W/H 2 to Market 1 $F$6 SF $7 Final Reduced Objective Allowable Allowable Value Cost Coefficient Increase Decrease 0 0 2 1 5 4 1E+30 5 2 5 1E+30 2 0 2 1 1E+30 0 3 2 3 2 2 1E+30 2 0 4 0 1 0 1 1 0 $G$6 W/H 1 to Market 3 0 0 5 1E+30 0 $G$7 W/H 2 to Market 3 50000 0 2 0 5 Constraints Final Shadow Constraint Allowable Allowable Cell Name Value Price R.H. Side Increase Decrease $C$18 Capacity Plant 1 140000 0 200000 1E+30 60000 $C$19 Capacity Plant 2 60000 -1 60000 90000 10000 $C$20 Demand Market 1 50000 3 50000 60000 50000 $C$21 Demand Market 2 100000 4 100000 60000 90000 $C$22 Demand Market 3 50000 5 50000 10000 50000 $C$23 Flow balance W/H 1 0 0 0 60000 140000 $C$24 Flow balance W/H 2 0 3 0 10000 90000 Figure 2: Sensitivity report Each part of the question is independent of the others and refers to the original problem. a) What is the optimal solution? Which constraints are binding? b) Interpret the shadow prices of the plant capacity constraints and the demand constraint [20%] [10%] for market 1. c) Suppose that the transportation cost from Plant 1 to warehouse 1 increases to 1 per Explain why (or why not) the optimal solution is affected by this change. What is the new objective function value? [10%] unit. d) Suppose the demand of market 2 increases by 15,000. How does this change affect the total distribution happens to the optimal solution? cost? What [15%] bypassing the e) Suppose that it is possible to supply market 1 directly from plant 1 (i.e., warehouses). How would you modify the original LP to take this distribution route into account? Suppose direct shipment. between plant 1 and market 1 cost 2.5 per desk. Should the company modify its distribution plan? f) g) [20%] How do you interpret the zern reduced cost for shipment between warehouse 1 and [10%] market 3? Suppose that warehouse 2 can handle only 50,000 desks per year. How would you modify the LP to account for this constraint? [15%]
Expert Answer:

Related Book For 

International Marketing And Export Management
ISBN: 9781292016924
8th Edition
Authors: Gerald Albaum , Alexander Josiassen , Edwin Duerr
Posted Date:
Students also viewed these finance questions
-
"internet radios" for streaming audio, and personal video recorders and players. Describe design and evaluation processes that could be used by a start-up company to improve the usability of such...
-
Planning is one of the most important management functions in any business. A front office managers first step in planning should involve determine the departments goals. Planning also includes...
-
What are the advantages and disadvantages of the net realizable method of allocating joint costs?
-
Raintree Marketing Corporation reported the following stockholders' equity at December 31 (adapted and in millions): Common stock...........................................$ 365 Additional paid-in...
-
Air flows with negligible friction through a 6-indiameter duct at a rate of 9 lbm/s. The temperature and pressure at the inlet are T 1 = 800 R and P 1 = 30 psia, and the Mach number at the exit is Ma...
-
Consider the following cash flow profile and assume MARR is 10 percent/year. a. What does Descartes' rule of signs tell us about the IRR(s) of this project? b. What does Norstrom's criterion tell us...
-
Here are comparative balance sheets for Taguchi Company. Additional information:1. Net income for 2010 was $103,000.2. Cash dividends of $45,000 were declared and paid.3. Bonds payable amounting to...
-
The local theater company is choosing its next play. The company's members recently held a vote to decide which of three choices - Elektra, Tartuffe, and Hamlet - the company will perform. The...
-
What are the basic steps that you follow when changing from one way of doing things to another way? This can be for daily things in life such as finding a new way to drive to work or using a new...
-
Why is the decision to conduct R&D in a particular location/subsidiary complex? What type of factors must be taken into account for this decision?
-
Why are new methods for market learning and understanding necessary? Identify the main types of development to improve market understanding and consequently innovation success.
-
What are the implications of continuous and discontinuous change for innovation?
-
Identify the basic characteristics associated with clan, hierarchy, market and adhocracy culture types.
-
Under what situations should you look to source knowledge externally and under what circumstances should it be created internally?
-
Prove that it is impossible for two reversible adiabatics to intersect. (Hint. Assume that they do intersect and complete the cycle with an is othermal. Show that the performance of this cycle...
-
In each of the following independent cases, document the system using whatever technique(s) your instructor specifies. a. Dreambox Creations (www.dreamboxcreations.com/) in Diamond Bar, California,...
-
Various classification schemes are sometimes used to given an indication of the potential of a foreign market/country. Explain why these schemes should or should not be used as a basis for deciding...
-
Exchange rate fluctuations between the Japanese yen, the euro, and the US dollar have posed serious problems for Strato Designs (the name of the company is disguised). The California company produces...
-
In 2010, General Motors was considering rebranding some of the vehicles produced by its Korean unit (Song, 2010). GM had purchased a controlling interest in Daewoo Motor Company, the car-making...
-
Some credit card issuers are beginning to assess fees and other charges on convenience users. Ask your friends and peers if they think a convenience credit card user should be charged for the...
-
Break into two or three groups to research the use of affinity cards. First, develop a list of affinity cards and their sponsors. Does your university sponsor a card? Next, each group should choose a...
-
Interview individuals who represent the three stages of the financial life cycle about their credit card usage. How many cards do they have? What kind or class of cards (rebate, premium, affinity,...

Study smarter with the SolutionInn App