

Question: Comparative figures for Apple and Google follow. table [ [ $ millions,Apple,Google ] , [ Current Year,One Year Prior,Two Years Prior,Current Year,One Year Prior,Two
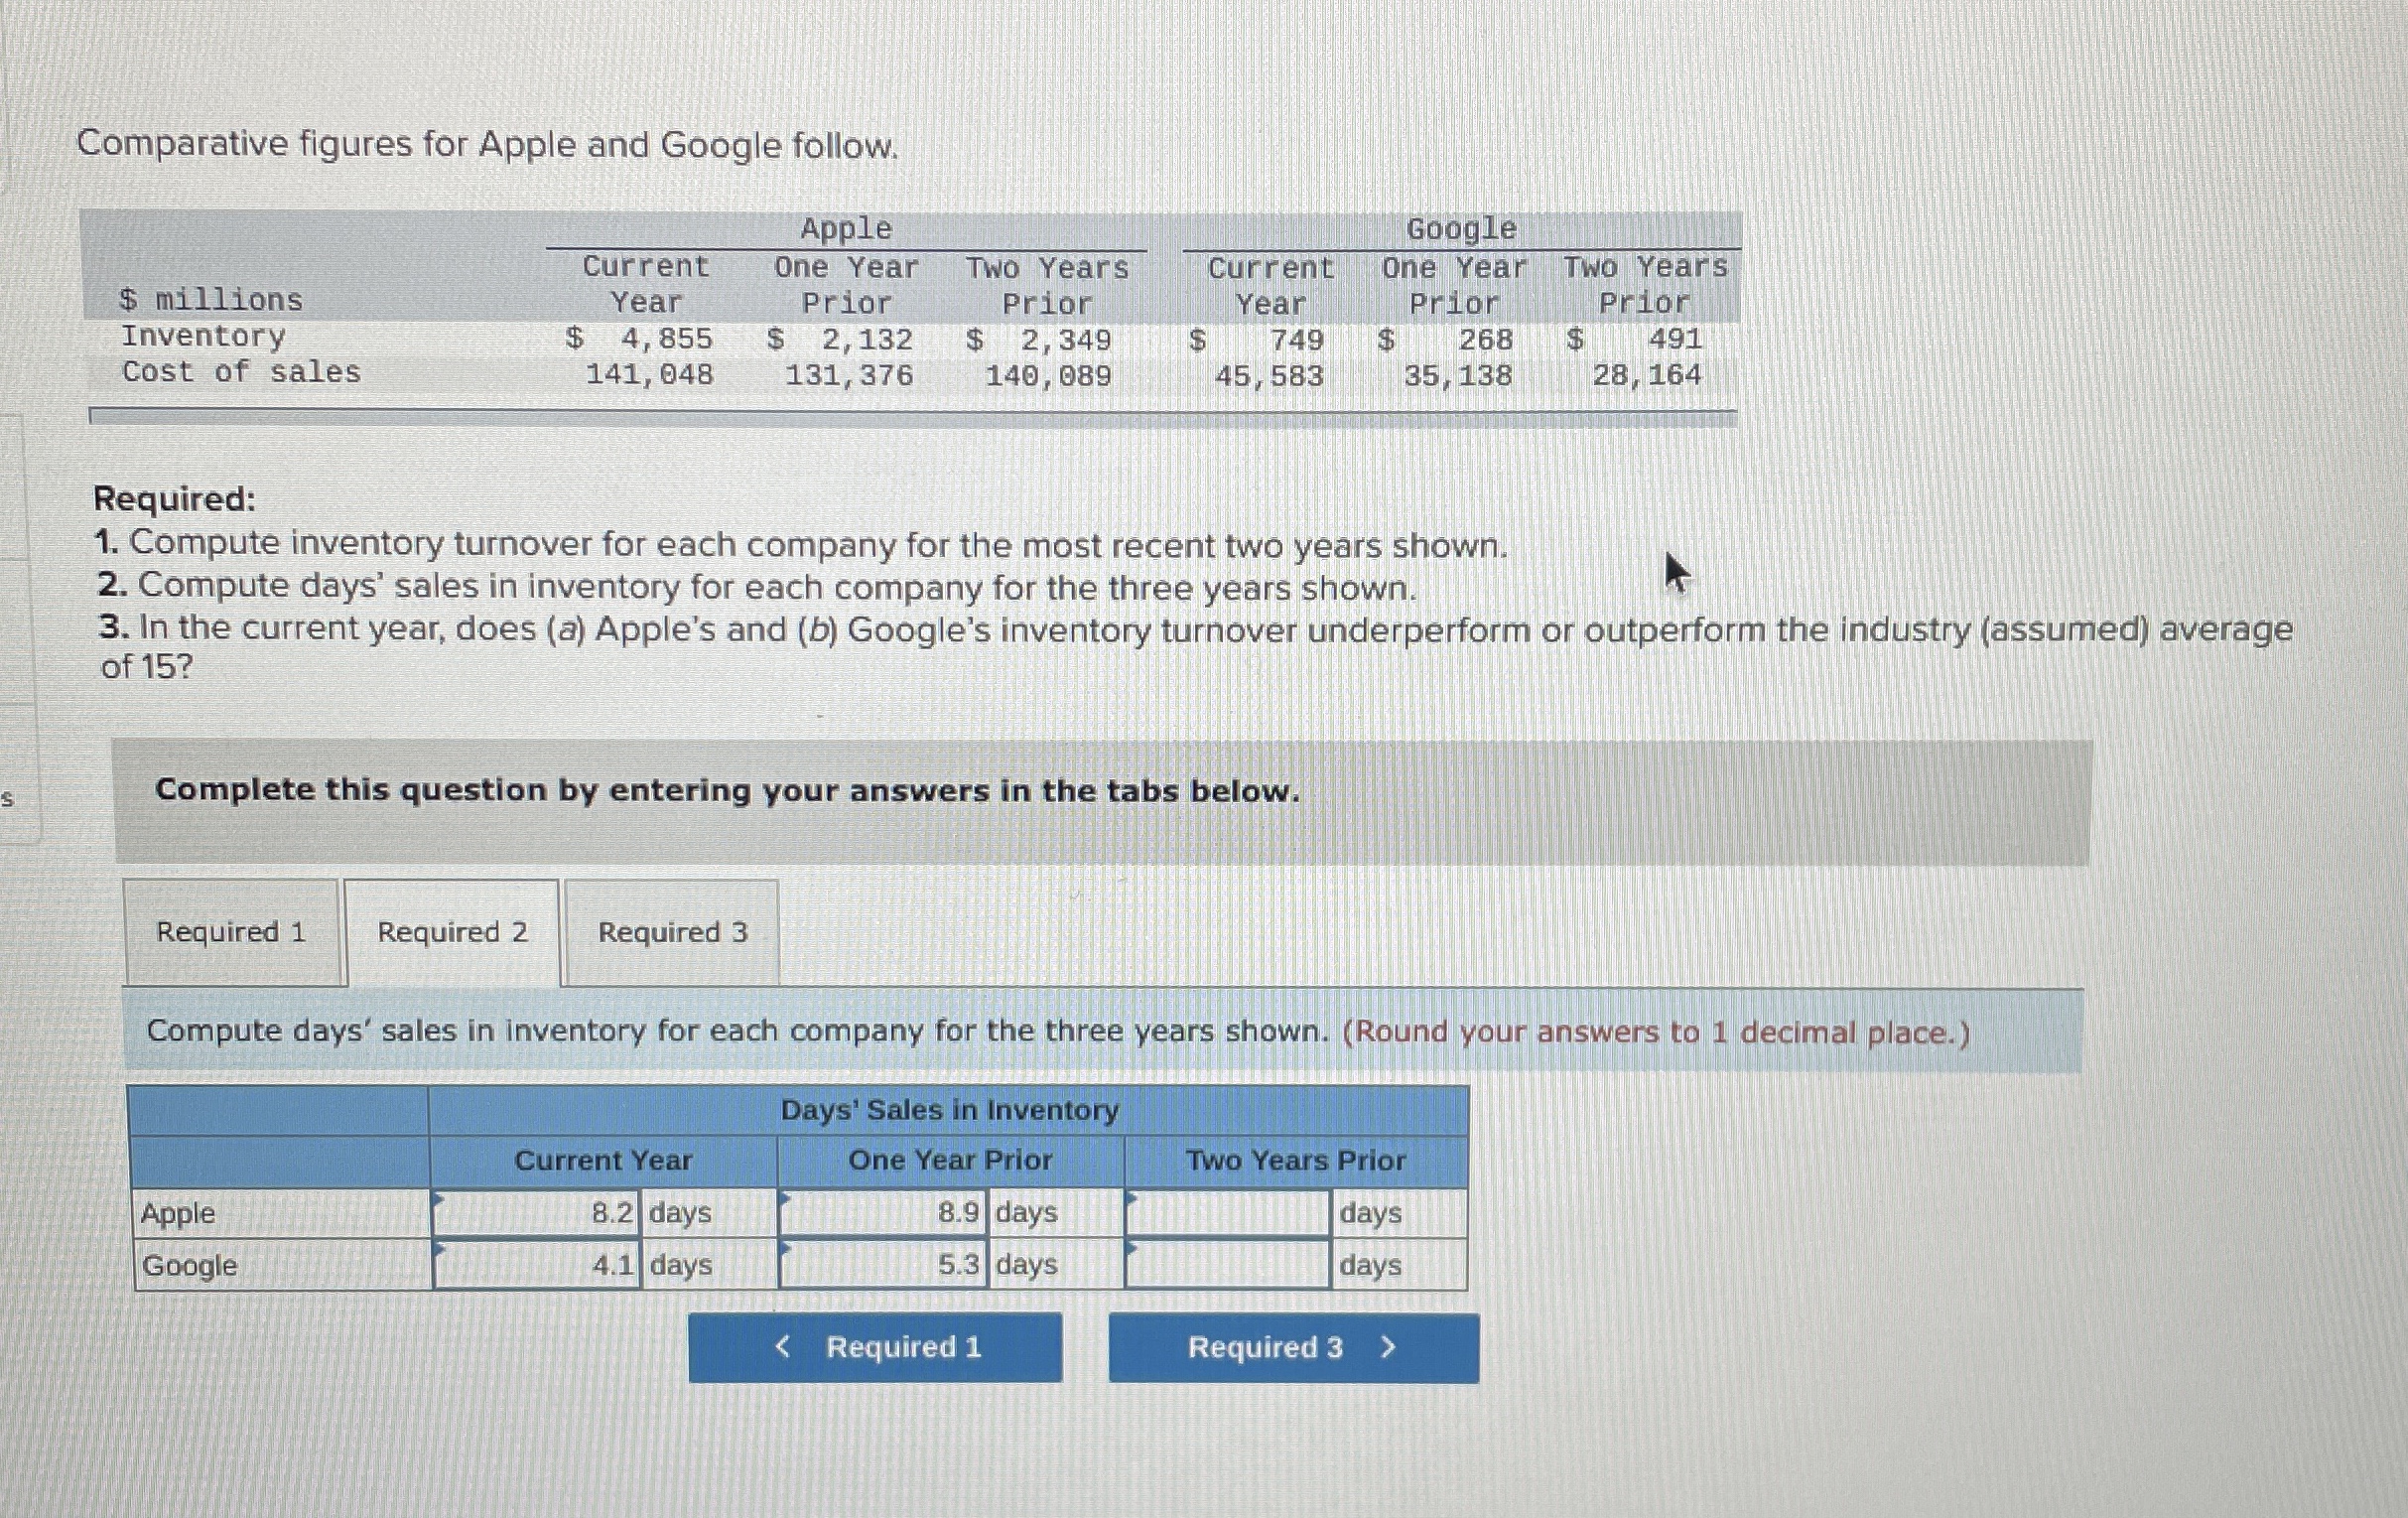
Comparative figures for Apple and Google follow.
table$ millions,Apple,GoogleCurrent Year,One Year Prior,Two Years Prior,Current Year,One Year Prior,Two Years PriorInventory$ $ $ $ $ $ Cost of sales,
Required:
Compute inventory turnover for each company for the most recent two years shown.
Compute days' sales in inventory for each company for the three years shown.
In the current year, does a Apple's and b Google's inventory turnover underperform or outperform the industry assumed average of
Complete this question by entering your answers in the tabs below.
Compute days' sales in inventory for each company for the three years shown. Round your answers to decimal place.
tableDays' Sales in Inventory,,Current Year,One Year Prior,Two Years Prior,,Appledays,days,,daysGoogledays,days,,days
Step by Step Solution
There are 3 Steps involved in it
1 Expert Approved Answer
Step: 1 Unlock

Question Has Been Solved by an Expert!
Get step-by-step solutions from verified subject matter experts
Step: 2 Unlock
Step: 3 Unlock