

Question: Comparative statement data for Farris Company and Ratzlaff Company, two competitors, appear below. All balance sheet data are as of December 31, 2015, and December
Comparative statement data for Farris Company and Ratzlaff Company, two competitors, appear below. All balance sheet data are as of December 31, 2015, and December 31, 2014.
| Farris Company | Ratzlaff Company | |||||||
| 2015 | 2014 | 2015 | 2014 | |||||
| Net sales | $1,575,677 | $339,305 | ||||||
| Cost of goods sold | 1,080,740 | 240,962 | ||||||
| Operating expenses | 303,677 | 79,070 | ||||||
| Interest expense | 8,680 | 2,260 | ||||||
| Income tax expense | 54,865 | 6,670 | ||||||
| Current assets | 324,047 | $312,609 | 83,970 | $ 79,171 | ||||
| Plant assets (net) | 520,365 | 501,197 | 139,336 | 124,946 | ||||
| Current liabilities | 64,433 | 74,030 | 35,991 | 29,109 | ||||
| Long-term liabilities | 107,330 | 91,629 | 29,422 | 25,095 | ||||
| Common stock, $10 par | 498,000 | 498,000 | 117,000 | 117,000 | ||||
| Retained earnings | 174,649 | 150,147 | 40,893 | 32,913 | ||||
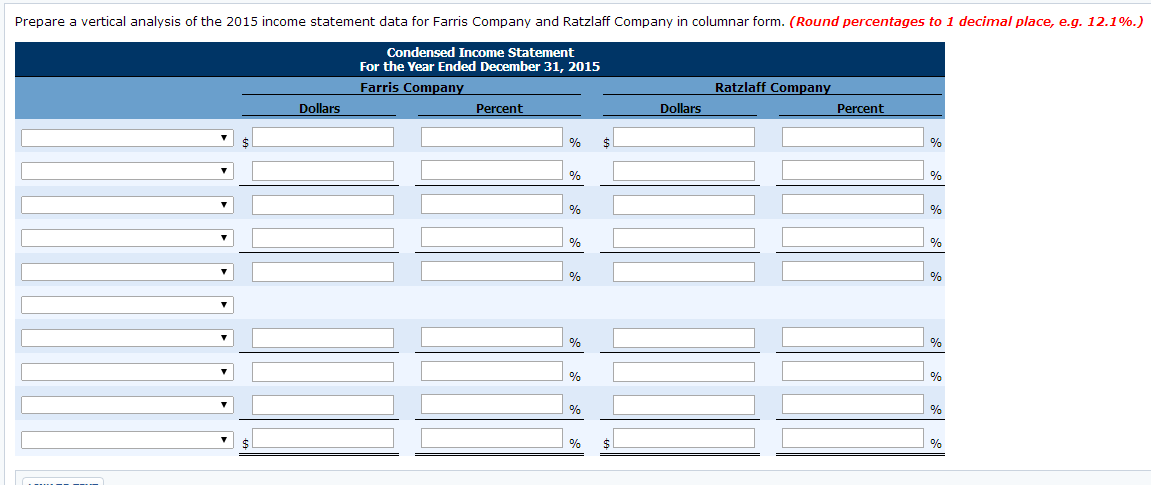
Prepare a vertical analysis of the 2015 income statement data for Farris Company and Ratzlaff Company in columnar form. (Round percentages to 1 decimal place, e.g. 12.1%.)
Step by Step Solution
There are 3 Steps involved in it
1 Expert Approved Answer
Step: 1 Unlock

Question Has Been Solved by an Expert!
Get step-by-step solutions from verified subject matter experts
Step: 2 Unlock
Step: 3 Unlock