

Question: Complete all lesson activities. Create a PNG image containing your E-R diagram for one of the listed datasets. Then create a 100-word summary describing what
Complete all lesson activities. Create a PNG image containing your E-R diagram for one of the listed datasets. Then create a 100-word summary describing what you learned while completing the activities in this lesson and how you can apply that learning to your own current or future environment.

Review the E-R diagram for the Northwind Database.
Select a graphical database design tool to use for this lesson. The GUI design tool you select should create something similar to the Northwind E-R diagram layout. Be sure to select a database diagramming tool, not a relationship modeling tool.
DBMS tools include Microsoft SQL Server Management Studio, MySQL Workbench, Oracle SQL Developer, Postgre GUI tools, and DBeaver.
Stand-alone graphical design tools include Creately, LibreOffice Draw, LucidChart, Microsoft Visio, and Visual Paradigm. Typical drawing programs (Microsoft Paint or similar) are not effective tools for this activity. Select a design tool rather than a drawing program.
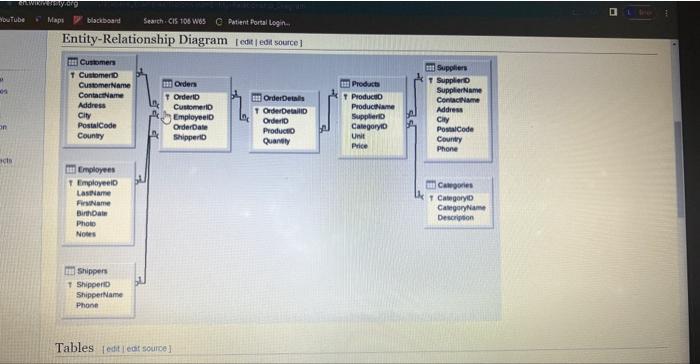
Complete all lesson activities. Create a PNG image containing your E-R diagram for one of the listed dotasets Then create a 100 word summary describing what you leamed while completing the activities in this lesson and how you can apply that leaming to your own current or future environment. See the Assignment Rubic undar Course Materials for more information. Proofread your assignment. Be sure to check for technical accuracy, content length, spelling. GUI Design Tool [ ealit ledit source] 1. Review the E-R diagram for the Northwind Database. 2. Select a graphical database design tool to use for this lesson. The GUI design tool you select should create something similar to the Northwind E:R diagram layout. Be sure to select a database diagramming tool, not a relationship modeling tool - DBMS tools include Microsoft SQL Server Management Studio, MySQL Wonkbench, Oracle SQL Developer, Postgre GUI toots, and DBeaver. - Stand-alone graphical design tooks include Creately, LbreOffice Draw, LucidChart, Microsoft Visio, and Visual Paradigm. Typical drawing programs (Microsott Paint or similar) are not effective tools for this activity. Select a design tool rather than a drawing program. E-R Diagram leait | eait source] Create a fully normalized E-R diagram for one or more of the following datasets 1. A car dealership wants a database to track sales by customer, vehicle, and sales person. 2. A college wants a database to track enroliment by student, course, and instructor. 3 A company wants a database to track their organizational structure by department, employee; and location. 4 A computer repair company wants a database to track repairs by customer, computer, and technician 5 A doctor's office wants a database to track patient visits by doctor, patient, and visit 6. Albrary wants a database to track books by title, author, and genre 7 A YouTube subscriber wants a database to track videos by subject, YouTuber, and playlist 8 Choose your own dataset similar to the above with at least three related entities Entity-Relationship Diagram ledt ede source] Tables ledit leor source 1
Step by Step Solution
There are 3 Steps involved in it

Get step-by-step solutions from verified subject matter experts