

Question: Complete below using MATLAB code % Plotting 3 graphs on same set of axes nPts=50; x=linspace(-3,3,nPts); % vector_containing x coordinates 7-3 to 3) - %
Complete below using MATLAB code
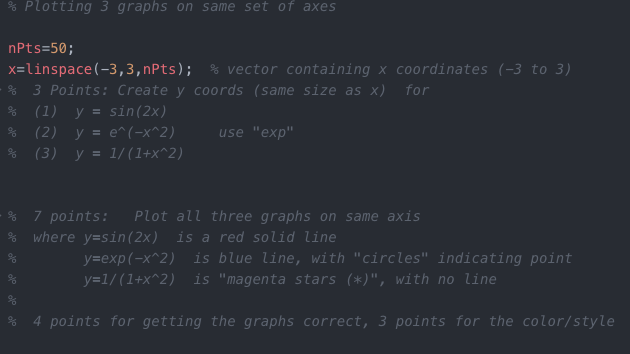
% Plotting 3 graphs on same set of axes nPts=50; x=linspace(-3,3,nPts); % vector_containing x coordinates 7-3 to 3) - % 3 Points: Create y coords (same size as x) for % (1) y = sin(2x) % (2) y = e^(-x^2) use "exp" % (3) y = 1/(1+X^2) - % 7 points: Plot all three graphs on same axis % where y=sin(2x) is a red solid line y=exp(-x^2) is blue line, with "circles" indicating point y=1/(1+X^2) is "magenta stars (*)", with no line do de de de % 4 points for getting the graphs correct, 3 points for the color/style
Step by Step Solution
There are 3 Steps involved in it
1 Expert Approved Answer
Step: 1 Unlock

Question Has Been Solved by an Expert!
Get step-by-step solutions from verified subject matter experts
Step: 2 Unlock
Step: 3 Unlock