

Question: Complete calculations on theExcel spreadsheetfor GM. AutoSave . Off H M2A2 GM FY16-17 - Protected View - Excel Search Salaheddine El Sayed SE X File
Complete calculations on theExcel spreadsheetfor GM.
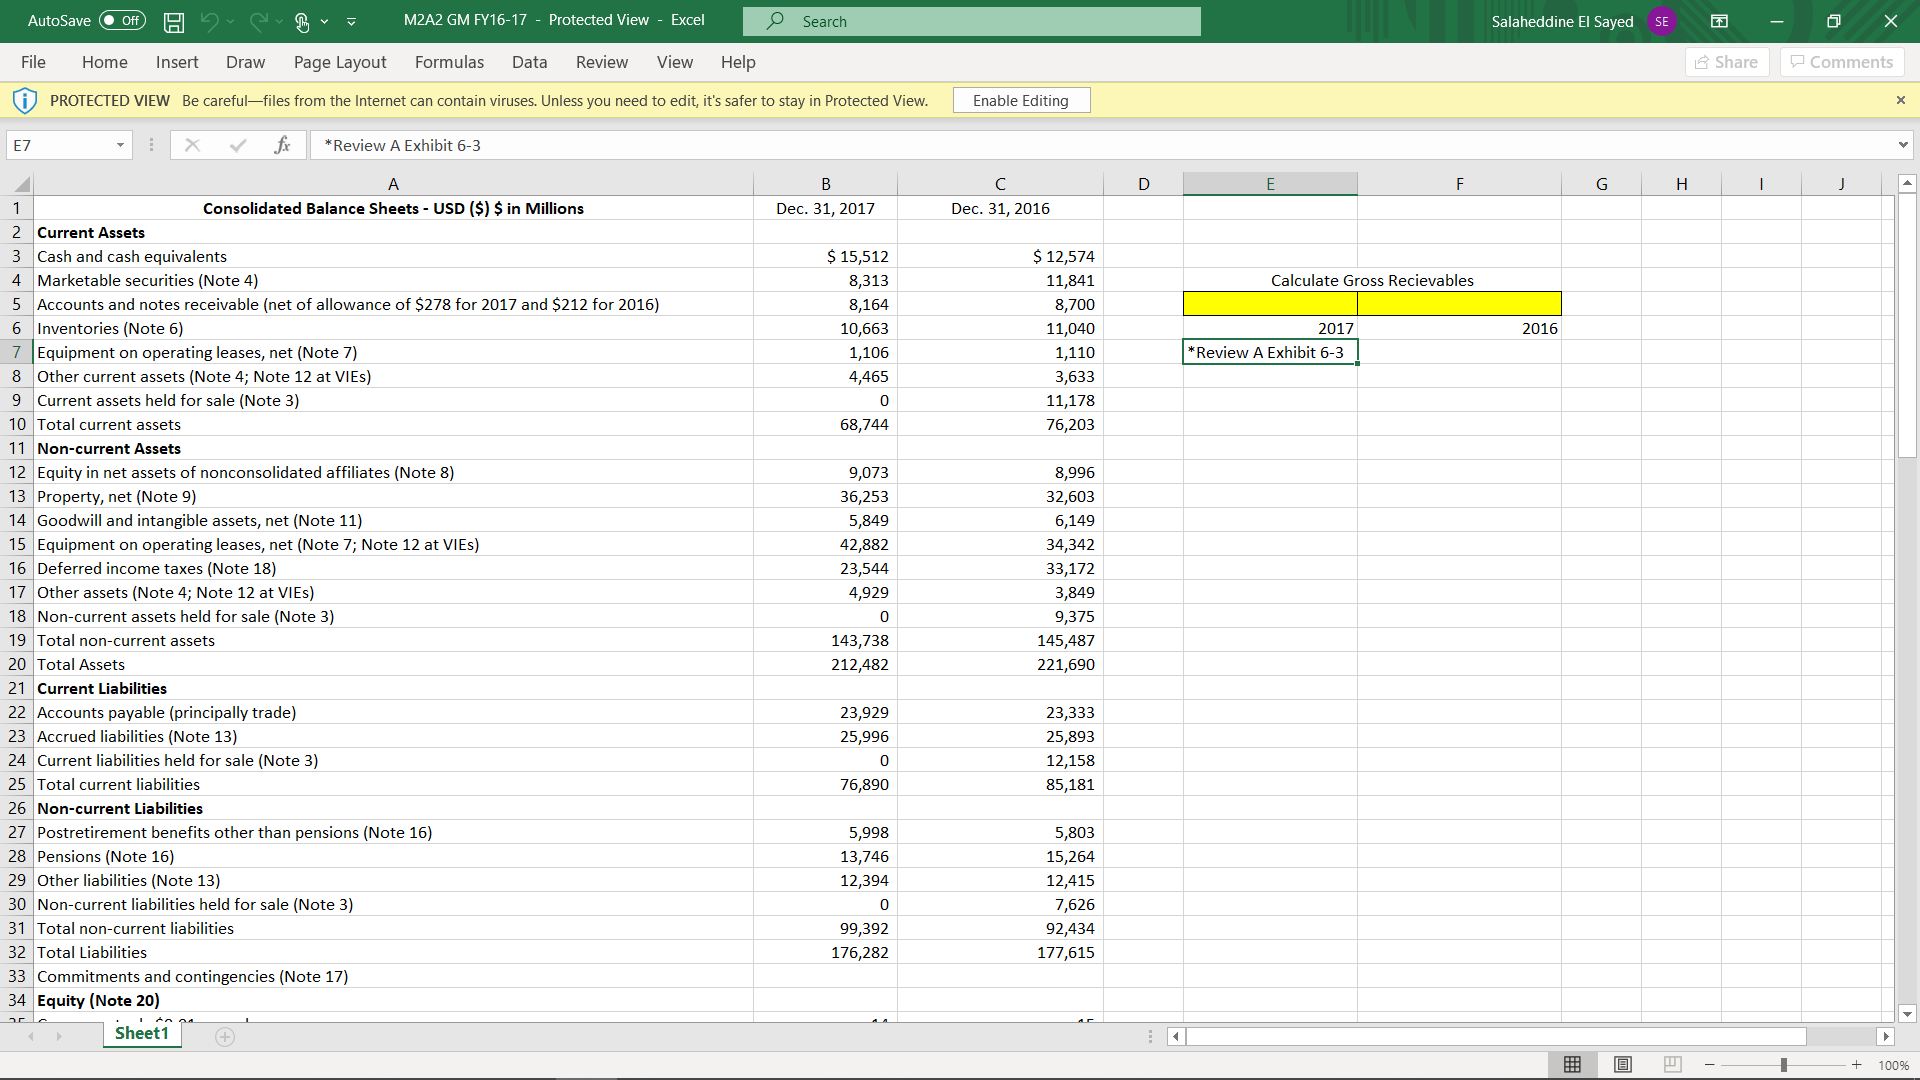
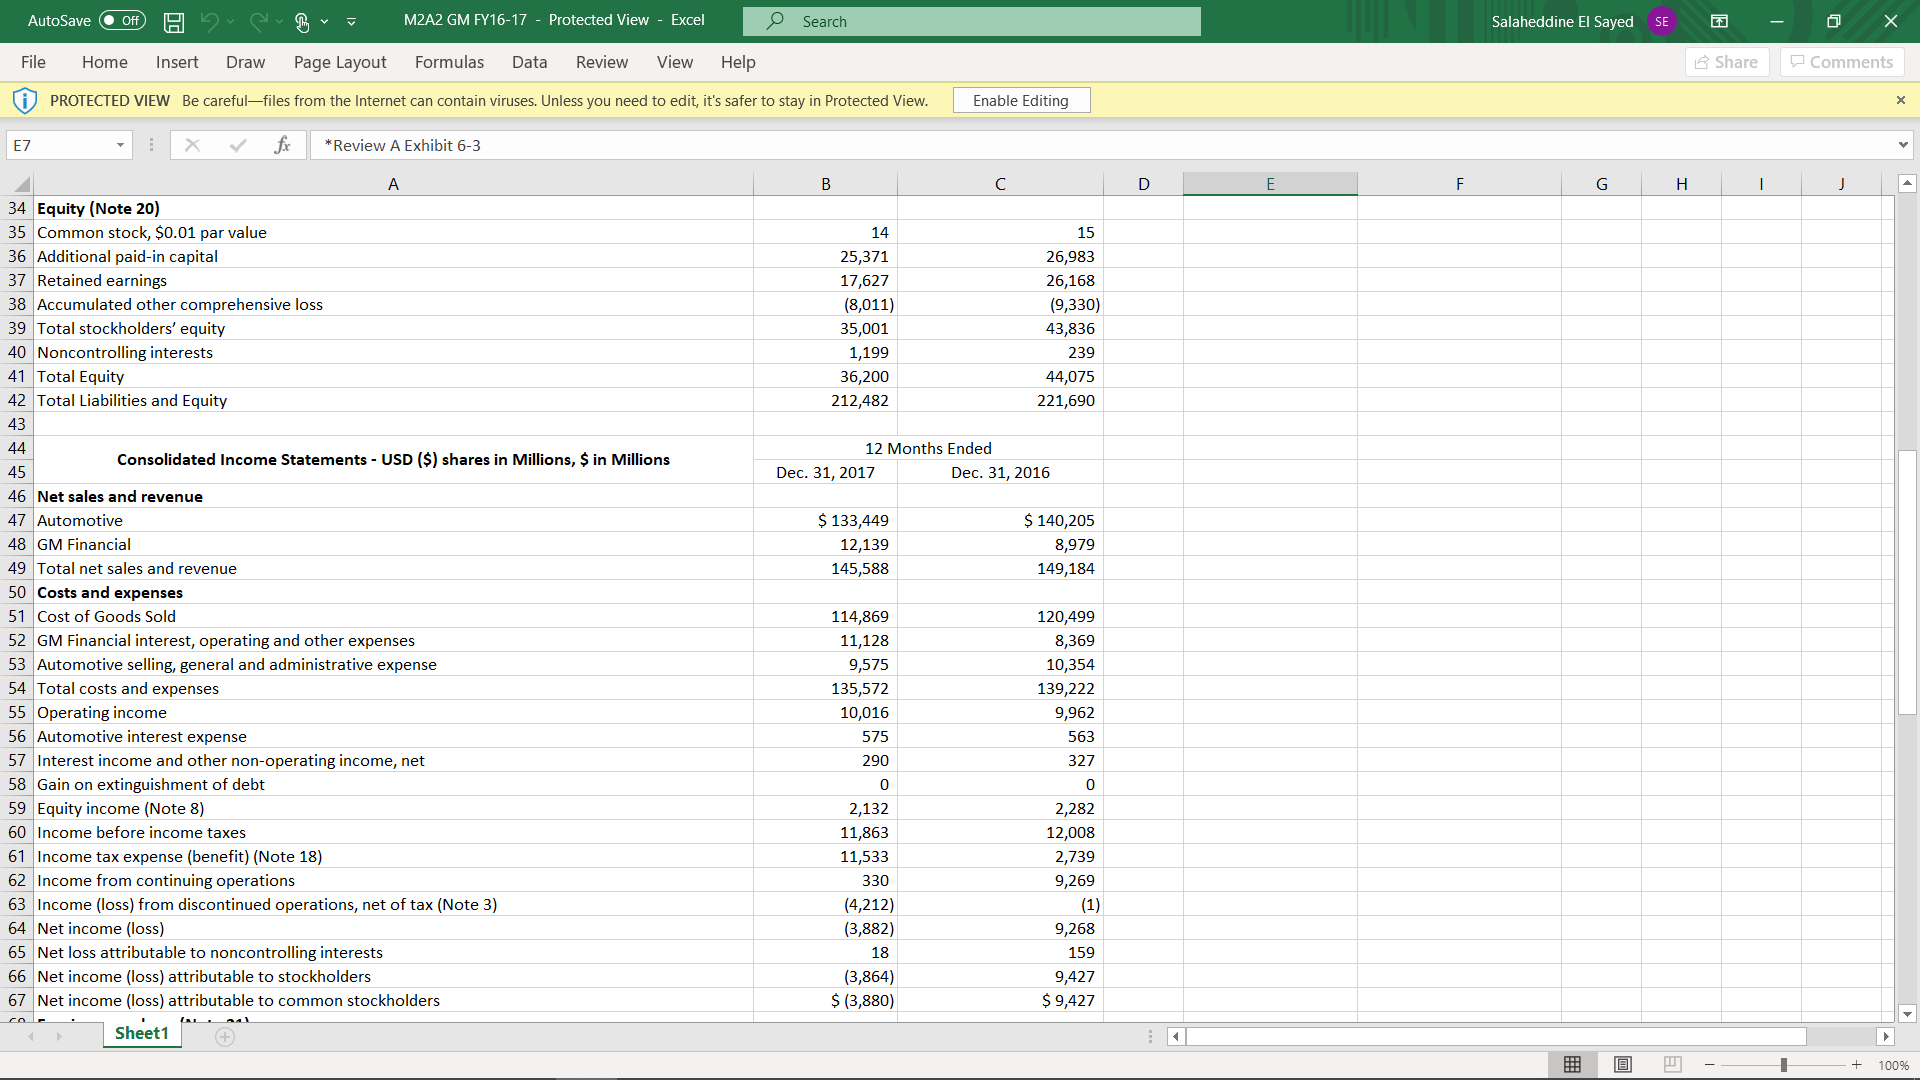
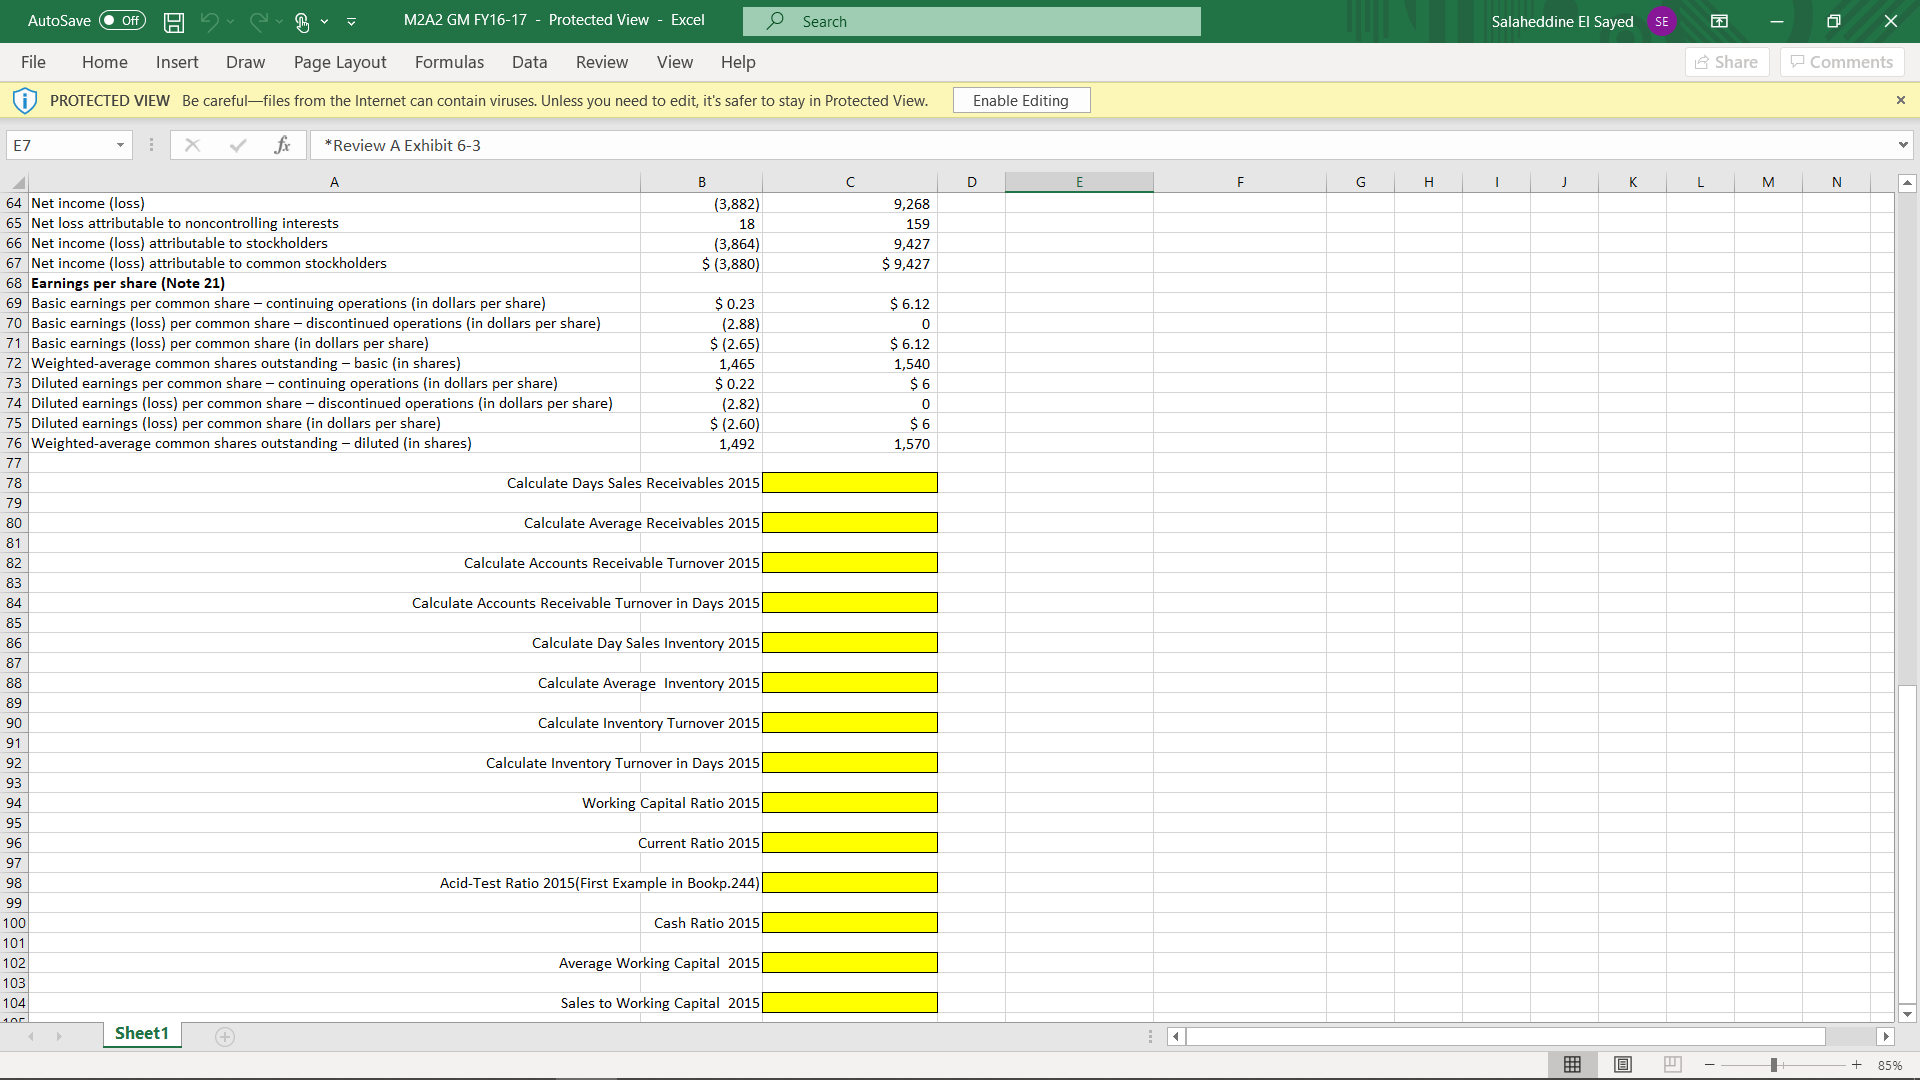
AutoSave . Off H M2A2 GM FY16-17 - Protected View - Excel Search Salaheddine El Sayed SE X File Home Insert Draw Page Layout Formulas Data Review View Share Comments PROTECTED VIEW Be careful-files from the Internet can contain viruses. Unless you need to edit, it's safer to stay in Protected View. Enable Editing X E7 X v fx *Review A Exhibit 6-3 B C D E F G H Consolidated Balance Sheets - USD ($) $ in Millions Dec. 31, 2017 Dec. 31, 2016 Current Assets Cash and cash equivalents $ 15,512 $ 12,574 Marketable securities (Note 4) 8,313 11,841 Calculate Gross Recievables 5 Accounts and notes receivable (net of allowance of $278 for 2017 and $212 for 2016) 8,164 3,700 6 Inventories (Note 6) 10,663 11,040 2017 2016 7 |Equipment on operating leases, net (Note 7) 1,106 1,110 *Review A Exhibit 6-3 8 Other current assets (Note 4; Note 12 at VIEs) 4,465 3,633 9 Current assets held for sale (Note 3) 11,178 10 Total current assets 68,744 76,203 11 Non-current Assets 12 Equity in net assets of nonconsolidated affiliates (Note 8) 9,073 8,996 13 Property, net (Note 9) 36,253 32,603 14 Goodwill and intangible assets, net (Note 11) 5,849 6,149 15 Equipment on operating leases, net (Note 7; Note 12 at VIEs) 42,882 34,342 16 Deferred income taxes (Note 18) 23,544 33,172 17 Other assets (Note 4; Note 12 at VIEs) 4,929 3,849 18 Non-current assets held for sale (Note 3) 9,375 19 Total non-current assets 143,738 145,487 20 Total Assets 212,482 221,690 21 Current Liabilities 22 Accounts payable (principally trade) 23,929 23,333 23 Accrued liabilities (Note 13) 25,996 25,893 24 Current liabilities held for sale (Note 3) 12,158 25 Total current liabilities 76,890 85,181 26 Non-current Liabilities 27 Postretirement benefits other than pensions (Note 16) 5,998 5,803 28 Pensions (Note 16) 13,746 15,264 29 Other liabilities (Note 13) 12,394 12,415 30 Non-current liabilities held for sale (Note 3) 7,626 31 Total non-current liabilities 99,392 92,434 32 Total Liabilities 176,282 177,615 33 Commitments and contingencies (Note 17) 34 Equity (Note 20) to pe Sheet1 + Q J - + 100%AutoSave . Off H M2A2 GM FY16-17 - Protected View - Excel Search Salaheddine El Sayed SE X File Home Insert Draw Page Layout Formulas Data Review View Share Comments PROTECTED VIEW Be careful-files from the Internet can contain viruses. Unless you need to edit, it's safer to stay in Protected View. Enable Editing X E7 *Review A Exhibit 6-3 A B C D E F G H 34 Equity (Note 20) 35 Common stock, $0.01 par value 14 15 36 Additional paid-in capital 25,371 26,983 37 Retained earnings 17,627 26,168 38 Accumulated other comprehensive loss (8,011) (9,330) 39 Total stockholders' equity 35,001 43,836 40 Noncontrolling interests 1,199 239 41 Total Equity 36,200 44,075 42 Total Liabilities and Equity 212,482 221,690 43 44 12 Months Ended 45 Consolidated Income Statements - USD ($) shares in Millions, $ in Millions Dec. 31, 2017 Dec. 31, 2016 46 Net sales and revenue 47 Automotive $ 133,449 $ 140,205 48 GM Financial 12,139 3,979 49 Total net sales and revenue 145,588 149,184 50 Costs and expenses 51 Cost of Goods Sold 114,869 120,499 52 GM Financial interest, operating and other expenses 11,128 8,369 53 Automotive selling, general and administrative expense 9.575 10,354 54 Total costs and expenses 135,572 139,222 55 Operating income 10,016 9,962 56 Automotive interest expense 575 563 57 Interest income and other non-operating income, net 290 327 58 Gain on extinguishment of debt 59 Equity income (Note 8) 2,132 2,282 60 Income before income taxes 11,863 12,008 61 Income tax expense (benefit) (Note 18) 11,533 2,739 62 Income from continuing operations 330 9,269 63 Income (loss) from discontinued operations, net of tax (Note 3) (4,212) (1) 64 Net income (loss) (3,882) 9,268 65 Net loss attributable to noncontrolling interests 18 159 66 Net income (loss) attributable to stockholders (3,864) 9,427 67 Net income (loss) attributable to common stockholders $ (3,880) $ 9,427 Sheet1 (+) Q J - + 100%AutoSave . Off H M2A2 GM FY16-17 - Protected View - Excel Search Salaheddine El Sayed SE X File Home Insert Draw Page Layout Formulas Data Review View Share Comments PROTECTED VIEW Be careful-files from the Internet can contain viruses. Unless you need to edit, it's safer to stay in Protected View. Enable Editing X E7 X V fx *Review A Exhibit 6-3 A B C D E F G H J K L M N 64 Net income (loss) (3,882) 9,268 65 Net loss attributable to noncontrolling interests 18 159 66 Net income (loss) attributable to stockholders (3,864) 9,427 67 Net income (loss) attributable to common stockholders $ (3,880 $ 9,427 68 Earnings per share (Note 21) 69 Basic earnings per common share - continuing operations (in dollars per share) $ 0.23 $ 6.12 70 Basic earnings (loss) per common share - discontinued operations (in dollars per share) (2.88 71 Basic earnings (loss) per common share (in dollars per share) $ (2.65) $ 6.12 72 Weighted-average common shares outstanding - basic (in shares) 1,465 1,540 73 Diluted earnings per common share - continuing operations (in dollars per share) $ 0.22 $ 6 74 Diluted earnings (loss) per common share - discontinued operations (in dollars per share) (2.82) 75 Diluted earnings (loss) per common share (in dollars per share) $ (2.60 $ 6 76 Weighted-average common shares outstanding - diluted (in shares) 1,492 1,570 77 78 Calculate Days Sales Receivables 2015 79 80 Calculate Average Receivables 2015 81 82 Calculate Accounts Receivable Turnover 2015 83 84 Calculate Accounts Receivable Turnover in Days 2015 85 86 Calculate Day Sales Inventory 2015 Calculate Average Inventory 2015 Calculate Inventory Turnover 2015 Calculate Inventory Turnover in Days 2015 Working Capital Ratio 2015 Current Ratio 2015 98 99 Acid-Test Ratio 2015(First Example in Bookp.244) 100 Cash Ratio 2015 101 102 Average Working Capital 2015 103 104 Sales to Working Capital 2015 Sheet1 + O J - + 85%
Step by Step Solution
There are 3 Steps involved in it

Get step-by-step solutions from verified subject matter experts