

Question: Complete Example 13.2: Process Control Chart Design, located in Chapter 13 of the textbook EXAMPLE 13.2: Process Control Chart Design An insurance company wants to
 Complete "Example 13.2: Process Control Chart Design," located in Chapter 13 of the textbook
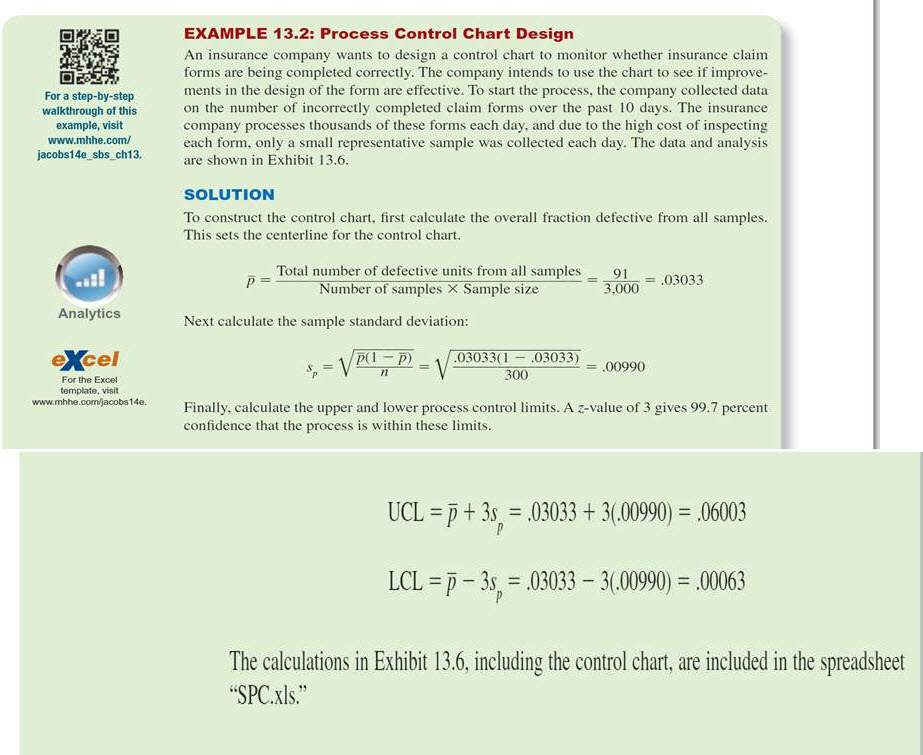
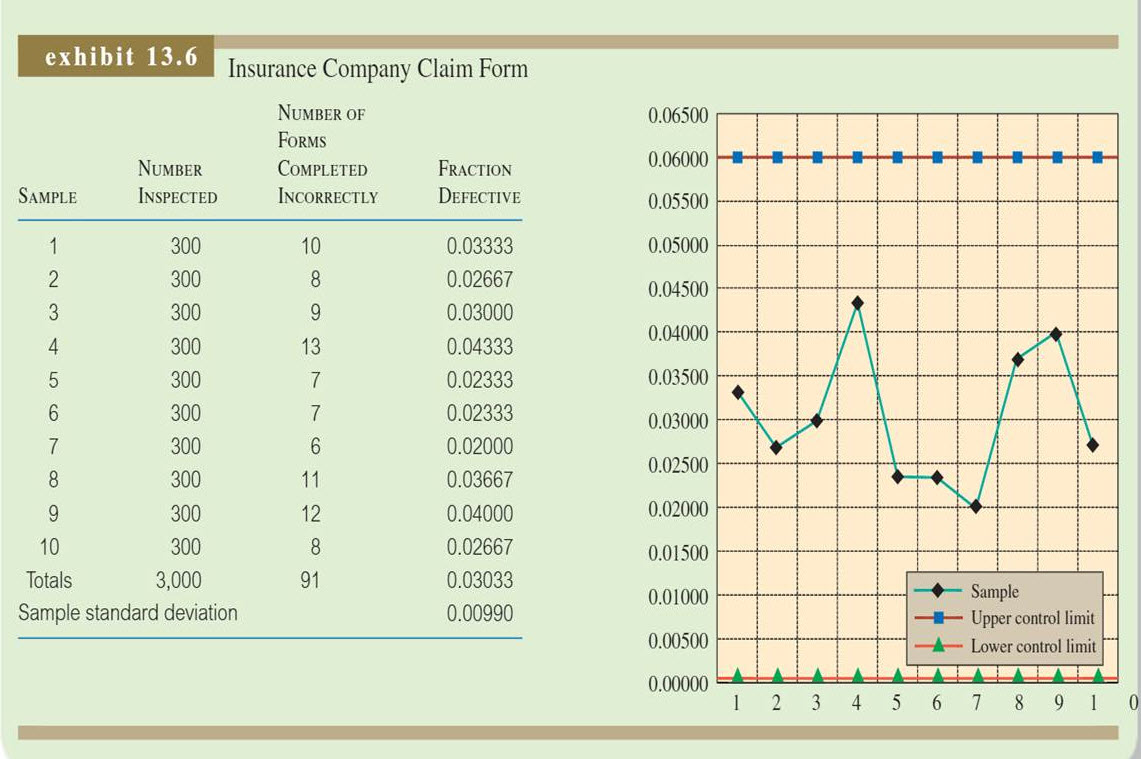
EXAMPLE 13.2: Process Control Chart Design An insurance company wants to design a control chart to monitor whether insurance claim forms are being completed correctly. The company intends to use the chart to see if improve- ments in the design of the form are effective. To start the process. the company collected data For a step-by-step walkthrough of this on the number of incorrectly completed claim forms over the past 10 days. The insurance example, visit company processes thousands of these forms each day, and due to the high cost of inspecting each form, only a small representative sample was collected each day. The data and analysis are shown in Exhibit www.mhhe.com/ jacobs 14e sbs ch13. SOLUTION To construct the control chart, first calculate the overall fraction defective from all samples. This sets the centerline for the control chart. Total number of defective units from all samples 91 03033 3,000 Number of samples X Sample size Analytics Next calculate the sample standard deviation: e Cel p(1 p2 0303301 03033) 00990 300 For the Excel template, visit 14e. Finally, calculate the upper and lower process control limits. A z value of 3 gives 99.7 percent confidence that the process is within these limits. UCLEp t 3s, .03033 +3(00990) 06003 LCL -p-3s 03033 3 00990) -.00063 The calculations in Exhibit 13.6, including the control chart, are included in the spreadsheet SPC.xls
Step by Step Solution
There are 3 Steps involved in it

Get step-by-step solutions from verified subject matter experts