

Question: Complete Example 13.2: Process Control Chart Design, located in Chapter 13 of the textbook using the Excel spreadsheet, Process Control Chart Design. Answer questions 1-8
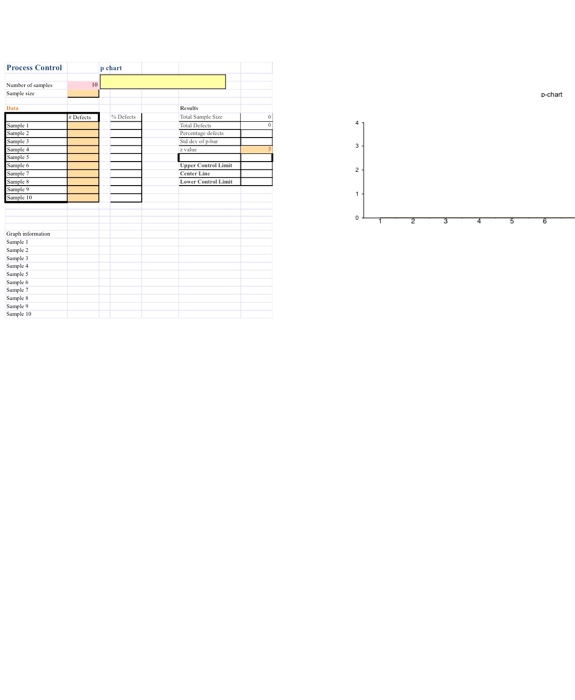
Complete Example 13.2: Process Control Chart Design, located in Chapter 13 of the textbook using the Excel spreadsheet, Process Control Chart Design.
Answer questions 1-8 from Case: Quality Management-Toyota, located at the end of Chapter 13 in the textbook.
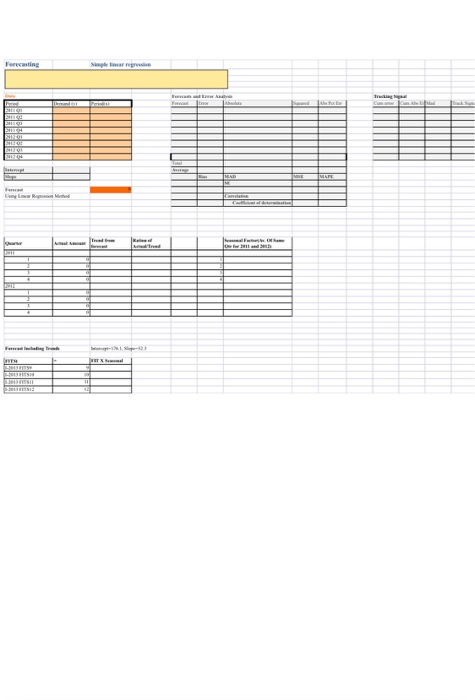
Refer to the Excel spreadsheet, "Computing Trend and Seasonal Factor," to complete Example 18.4: Computing Trend and Seasonal Factor From a Linear Regression Line Obtained With Excel, located in Chapter 18 of the textbook.
After working through the examples, write a 150-300-word paragraph explaining the following:
Comparison of the simple moving average, weighted moving average, exponential smoothing, and linear regression analysis time series models
Description of market research, panel consensus, historical analogy, and Delphi method qualitative forecasting techniques.
While APA format is not required for the body of this assignment, solid academic writing is expected, and documentation of sources should be presented using APA formatting guidelines, which can be found in the APA Style Guide, located in the Student Success Center.
please be mindful of plagrism
Step by Step Solution
There are 3 Steps involved in it
1 Expert Approved Answer
Step: 1 Unlock

Question Has Been Solved by an Expert!
Get step-by-step solutions from verified subject matter experts
Step: 2 Unlock
Step: 3 Unlock