

Question: Complete PART (b) ONLY. Please use answer from Part (a). Please complete this using EXCEL; SHow the steps/ excel calculations. Month Actual Demand 1 62
Complete PART (b) ONLY. Please use answer from Part (a). Please complete this using EXCEL; SHow the steps/ excel calculations.
| Month | Actual Demand |
| 1 | 62 |
| 2 | 65 |
| 3 | 67 |
| 4 | 68 |
| 5 | 71 |
| 6 | 73 |
| 7 | 76 |
| 8 | 78 |
| 9 | 78 |
| 10 | 80 |
| 11 | 84 |
| 12 | 85 |
part (a)

MY ANSWER TO PART (a)
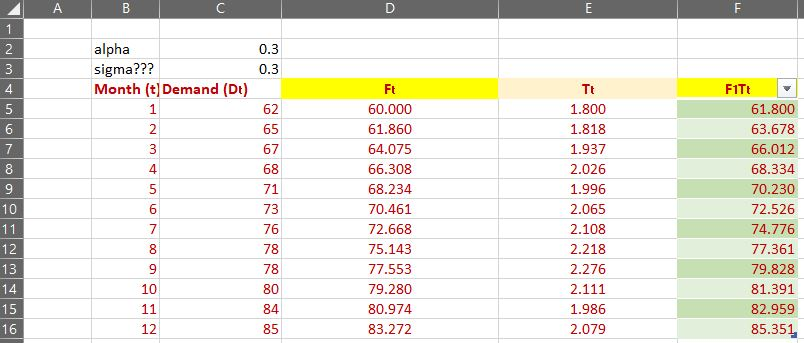
PART (b)
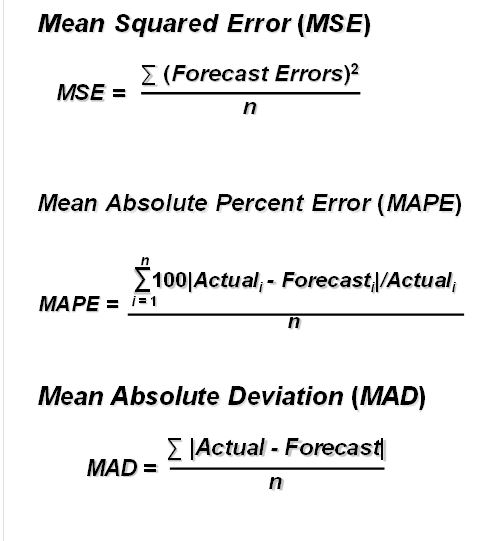
Now calculate all the measures of forecasting accuracy listed below for the single exponential smoothing with trend component forecast completed in part (a)
-i) MAPE (Mean Absolute Percent Error)
- ii) MSE (Mean squared error)
- iii) MAD (Mean absolute Deviation)
PLEASE SHOW YOUR WORK USING EXCEL
FORMULAS:
Step by Step Solution
There are 3 Steps involved in it
1 Expert Approved Answer
Step: 1 Unlock

Question Has Been Solved by an Expert!
Get step-by-step solutions from verified subject matter experts
Step: 2 Unlock
Step: 3 Unlock