

Question: Complete the data for Years 1-30 below, then create a chart comparing how money grows at the different interest rates. Principal $1,000 Year @
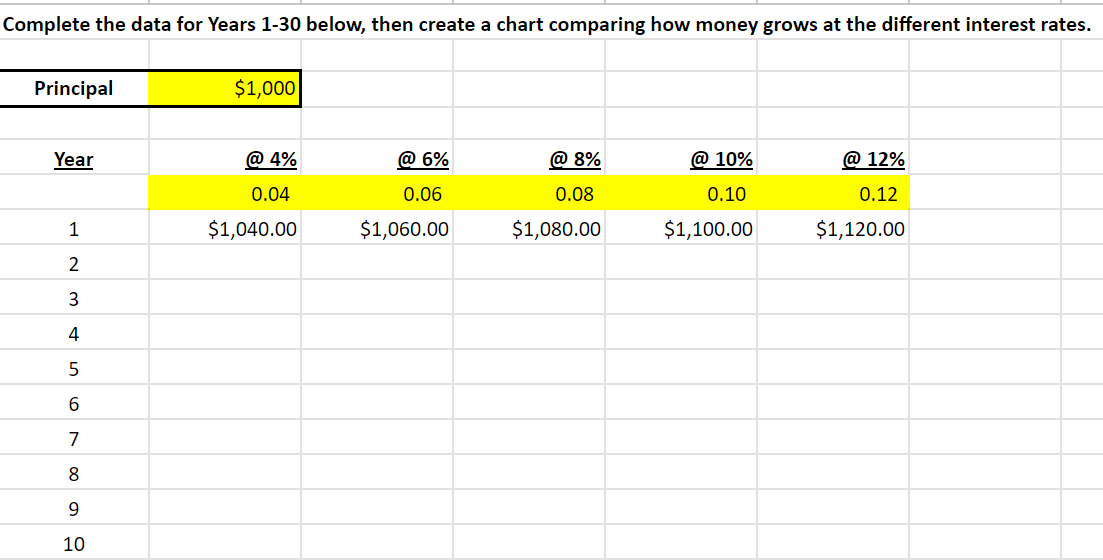

Complete the data for Years 1-30 below, then create a chart comparing how money grows at the different interest rates. Principal $1,000 Year @ 4% @ 6% @ 8% @ 10% @ 12% 0.04 0.06 0.08 $1,040.00 $1,060.00 $1,080.00 0.10 $1,100.00 0.12 $1,120.00 123456 7 8 9 10 11 12 13 14 15 16 17 18 19 20 21 22 23 24 25 26 26 27 28 29 30
Step by Step Solution
There are 3 Steps involved in it
1 Expert Approved Answer
Step: 1 Unlock

Question Has Been Solved by an Expert!
Get step-by-step solutions from verified subject matter experts
Step: 2 Unlock
Step: 3 Unlock