

Question: Complete the function using Matlab Requirements: Write a function Projection Plot that plots the vectors a-OA, b-OB, and e-OC, where e is the projection of
Complete the function using Matlab
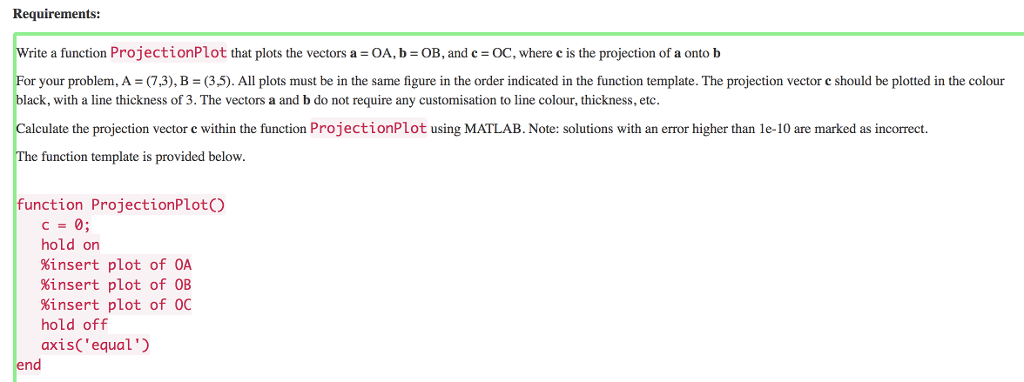
Requirements: Write a function Projection Plot that plots the vectors a-OA, b-OB, and e-OC, where e is the projection of a onto b For your problem, A (7,3), B (35). All plots must be in the same figure in the order indicated in the function template. The projection vector c should be plotted in the colour black, with a line thickness of 3. The vectors a and b do not require any customisation to line colour, thickness, etc Calculate the projection vector e within the function ProjectionPlot using MATLAB. Note: solutions with an error higher than le-10 are marked as incorrect The function template is provided below function ProjectionPlotO c=0; hold on %insert plot of OA %insert plot of 0B %insert plot of 0C hold off axis('equal' end
Step by Step Solution
There are 3 Steps involved in it

Get step-by-step solutions from verified subject matter experts