

Question: Complete the table below, and add the data to your Scatter Plot as a separate data set. Include a Linear fit and the equation
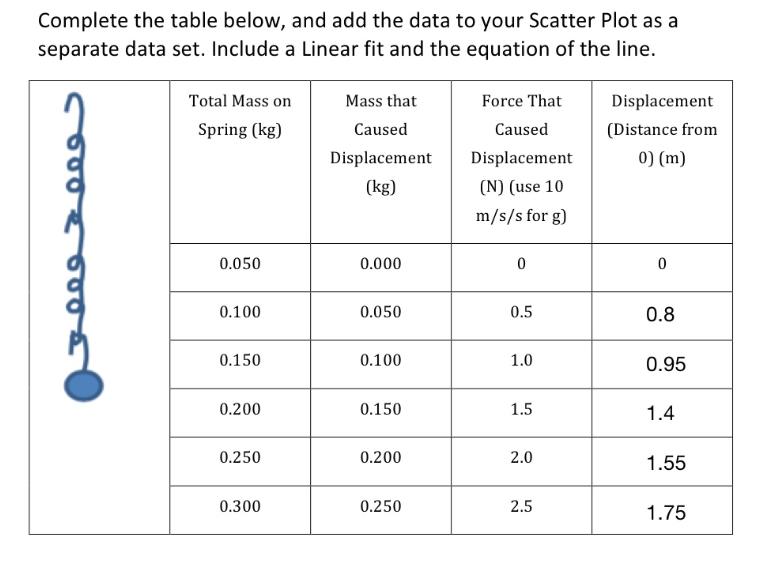
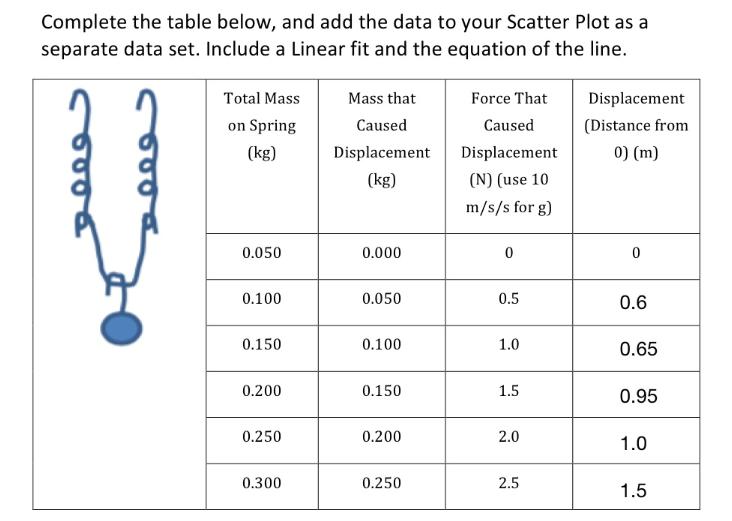
Complete the table below, and add the data to your Scatter Plot as a separate data set. Include a Linear fit and the equation of the line. 6005 Total Mass on Spring (kg) Mass that Caused Displacement Force That Displacement Caused Displacement (Distance from 0) (m) (kg) (N) (use 10 m/s/s for g) 0.050 0.000 0 0 0.100 0.050 0.5 0.8 0.150 0.100 1.0 0.95 0.200 0.150 1.5 1.4 0.250 0.200 2.0 1.55 0.300 0.250 2.5 1.75 6. Comment on how the slope of the line for the springs in series and the single spring are related. 7. What is the spring constant for the Series combination? Complete the table below, and add the data to your Scatter Plot as a separate data set. Include a Linear fit and the equation of the line. Total Mass on Spring Mass that Caused Force That Displacement (kg) Displacement Caused Displacement (Distance from 0) (m) (kg) (N) (use 10 m/s/s for g) 0.050 0.000 0 0 0.100 0.050 0.5 0.6 0.150 0.100 10 1.0 0.65 0.200 0.150 1.5 0.95 0.250 0.200 2.0 1.0 0.300 0.250 2.5 1.5 8. Comment on how the slope of the line for the springs in parallel and the single spring are related. 9. What is the spring constant for the parallel combination?
Step by Step Solution
There are 3 Steps involved in it

Get step-by-step solutions from verified subject matter experts