

Question: 4) Complete the table below for the figures from a business that has a monopoly on widgets. Fixed costs are $25, and MC is
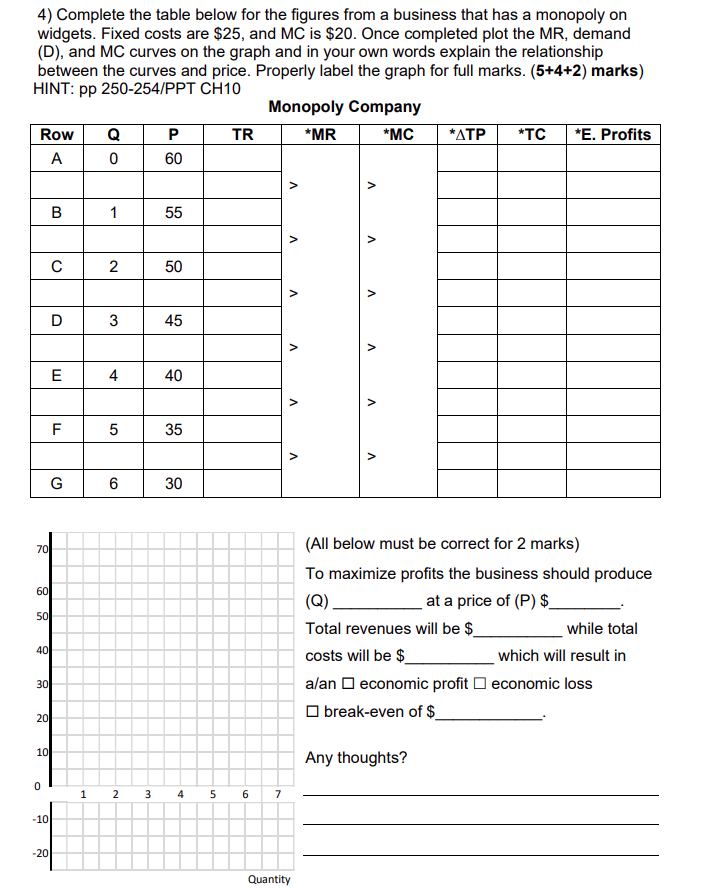

4) Complete the table below for the figures from a business that has a monopoly on widgets. Fixed costs are $25, and MC is $20. Once completed plot the MR, demand (D), and MC curves on the graph and in your own words explain the relationship between the curves and price. Properly label the graph for full marks. (5+4+2) marks) HINT: pp 250-254/PPT CHIO Monopoly Company Row Q TR Qua ntity *ATP Profits (All below must be correct for 2 marks) To maximize profits the business should produce (Q) at a price of (P) $ Total revenues will be $ costs will be $ while total which will result in alan economic profit D economic loss O break-even of $ Any thoughts?
Step by Step Solution
There are 3 Steps involved in it

Get step-by-step solutions from verified subject matter experts