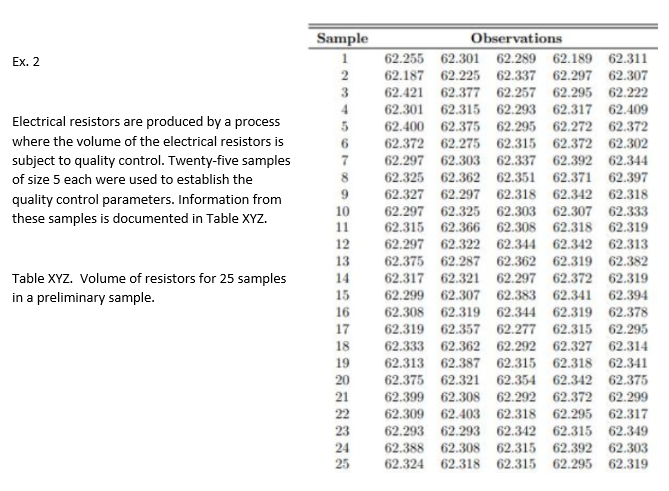
Question: Compute and draw the appropriate process control chart(s) for the data. What should be done next? Discuss Sample Ex. 2 2 Electrical resistors are produced

Compute and draw the appropriate process control chart(s) for the data. What should be done next? Discuss

Compute and draw the appropriate process control

Sample Ex. 2 2 Electrical resistors are produced by a process where the volume of the electrical resistors is subject to quality control. Twenty-five samples of size 5 each were used to establish the quality control parameters. Information from these samples is documented in Table XYZ. Observations 62.255 62.301 62.289 62.189 62.311 62.187 62.225 62.337 62.297 62.307 62.421 62.377 62.257 62.295 62.222 62.301 62.315 62.293 62.317 62.409 62.400 62.375 62.295 62.272 62.372 62.372 62.275 62.315 62.372 62.302 62.297 62.303 62.337 62.392 62.344 62.325 62.362 62.351 62.371 62.397 62.327 62.297 62.318 62.342 62.318 62.297 62.325 62.303 62.307 62.333 62.315 62.366 62.308 62.318 62.319 62.297 62.322 62.344 62.342 62.313 62.375 62.287 62.362 62.319 62.382 62.317 62.321 62.297 62.372 62.319 62.299 62.307 62.383 62.34162.394 62.308 62.319 62.344 62.319 62.378 62.319 62.357 62.277 62.315 62.295 62.333 62.362 62.292 62.327 62.314 62.313 62.387 62.315 62.318 62.341 62.375 62.321 62.354 62.342 62.375 62.399 62.308 62.292 62.372 62.299 62.309 62.403 62.318 62.295 62.317 62.293 62.293 62.342 62.315 62.349 62.388 62.308 62.315 62.392 62.303 62.324 62.318 62.315 62.295 62.319 4 5 6 7 8 9 10 11 12 13 14 15 16 17 18 19 20 21 22 23 24 25 Table XYZ. Volume of resistors for 25 samples in a preliminary sample

Step by Step Solution

There are 3 Steps involved in it

1 Expert Approved Answer
Step: 1 Unlock blur-text-image
Question Has Been Solved by an Expert!

Get step-by-step solutions from verified subject matter experts

Step: 2 Unlock
Step: 3 Unlock

Students Have Also Explored These Related General Management Questions!