

Question: Computer Science: First Year - Python 3 w/ PyCharm - Starter Code: import numpy as np import csv # put the csv file in the
Computer Science: First Year
-
Python 3 w/ PyCharm
-
Starter Code:
import numpy as np import csv
# put the csv file in the same folder as your program f = open('age_statistics.csv', 'r') csvreader = csv.reader(f, delimiter=',') data = [] for row in csvreader: row1 = [item.replace(',', '') for item in row] # This is used to remove the thousand separator , in each row data.append(row1) print(data)
# write your assignment based on the varaible data
-
Starter Information: https://drive.google.com/file/d/1qN8UExdydyAcZF2WPhUrMgI-pBIYa6YI/view?usp=sharing
-
-
Will rate thumbs up!
-
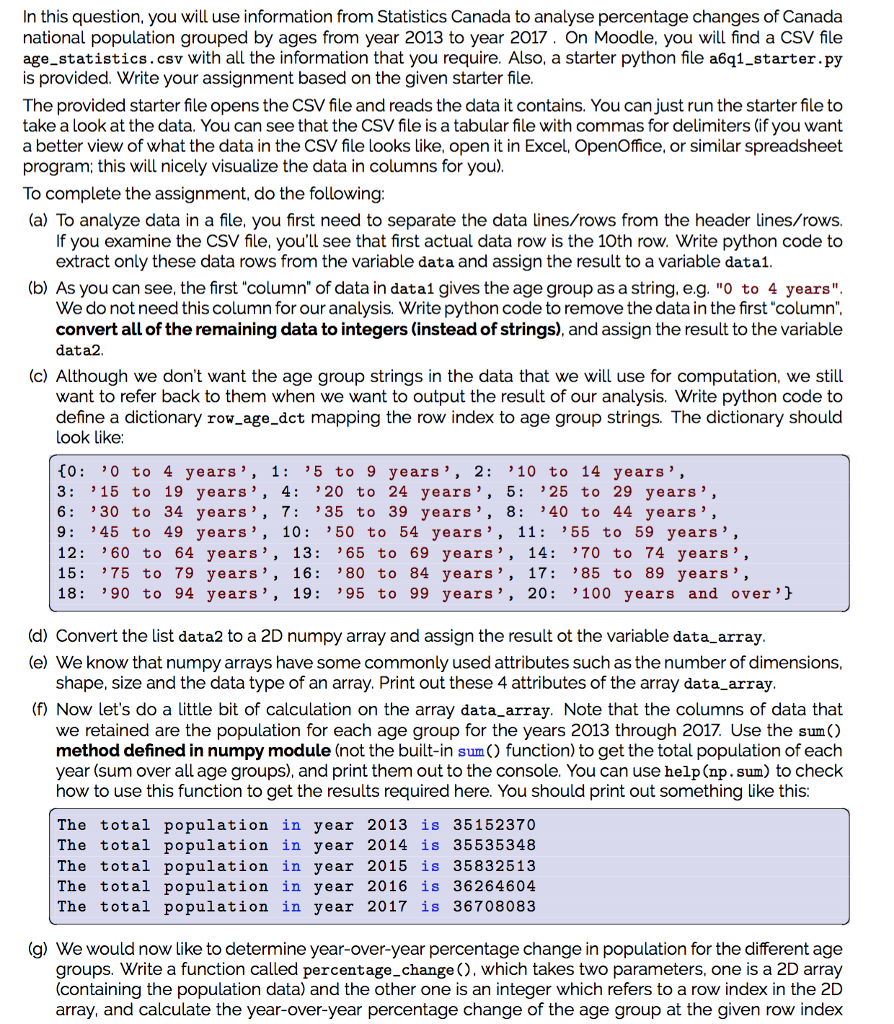
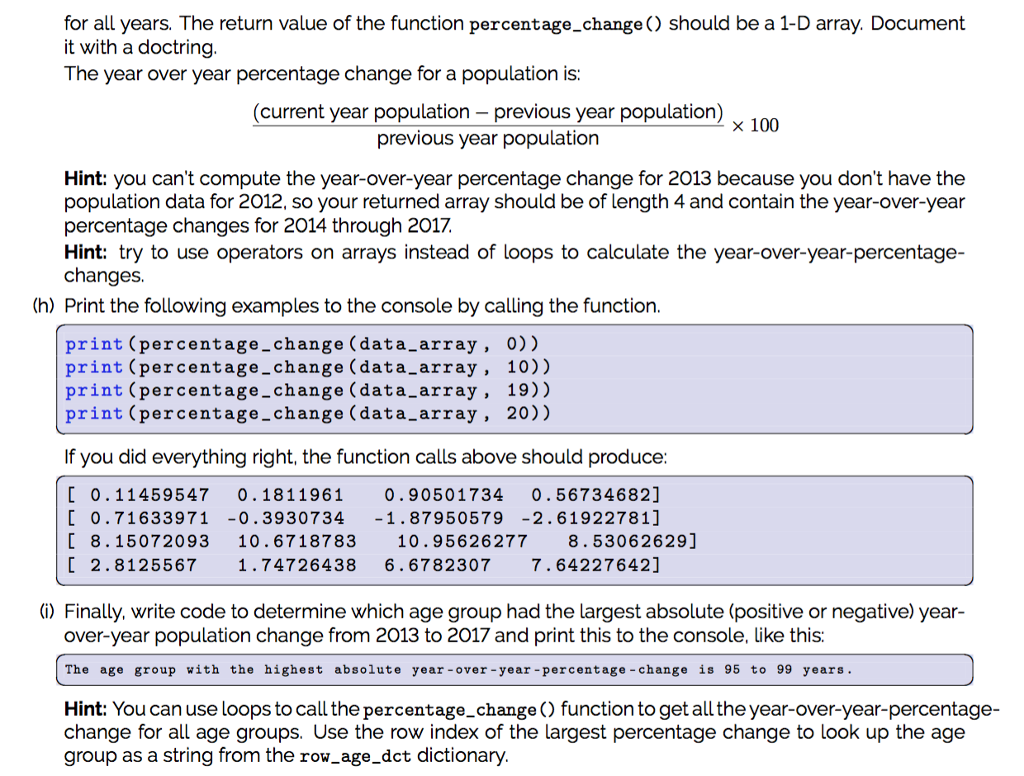
In this question, you will use information from Statistics Canada to analyse percentage changes of Canada national population grouped by ages from year 2013 to year 2017. On Moodle, you will find a CSV file age_statistics.csv with all the information that you require. Also, a starter python file a6q1_starter.py is provided. Write your assignment based on the given starter file The provided starter file opens the CSV file and reads the data it contains. You can just run the starter file to take a look at the data. You can see that the CSV file is a tabular file with commas for delimiters (if you want a better view of what the data in the CSV file looks like, open it in Excel, OpenOffice, or similar spreadsheet program; this will nicely visualize the data in columns for you) To complete the assignment, do the following (a) To analyze data in a file, you first need to separate the data ines/rows from the header lines/rows. If you examine the CSV file, you'll see that first actual data row is the 10th row. Write python code to extract only these data rows from the variable data and assign the result to a variable datai (b) As you can see, the first "column" of data in data1 gives the age group as a string, e.g. "O to 4 years". We do not need this column for our analysis. Write python code to remove the data in the first"column". convert all of the remaining data to integers (instead of strings), and assign the result to the variable data2 (c) Although we don't want the age group strings in the data that we will use for computation, we still want to refer back to them when we want to output the result of our analysis. Write python code to define a dictionary row age dct mapping the row index to age group strings. The dictionary should ook like: t0 0 to 4 years', 1: '5 to 9 years', 2: 10 to 14 years' 3: 15 to 19 years', 4: '20 to 24 years', 5: 25 to 29 years', 6 30 to 34 years, 7: '35 to 39 years', 8: 40 to 44 years' 9: 45 to 49 years', 10: ' 50 to 54 years', 11: '55 to 59 years', 12: 60 to 64 years', 13: 65 to 69 years', 14: '70 to 74 years, 15: 75 to 79 years', 16: 80 to 84 years', 17: '85 to 89 years', 18 '90 to 94 years', 19: '95 to 99 years', 20: '100 years and over'] (d) Convert the list data2 to a 2D numpy array and assign the result ot the variable data_array (e) We know that numpy arrays have some commonly used attributes such as the number of dimensions shape, size and the data type of an array. Print out these 4 attributes of the array data_array (f) Now let's do a little bit of calculation on the array data_array. Note that the columns of data that we retained are the population for each age group for the years 2013 through 2017. Use the sum() method defined in numpy module (not the built-in sum ) function) to get the total population of each year (sum over all age groups), and print them out to the console. You can use help (np. sum) to check how to use this function to get the results required here. You should print out something like this: The total population in year 2013 is 35152370 The total population in year 2014 is 35535348 The total population in year 2015 is 35832513 The total population in year 2016 is 36264604 The total population in year 2017 is 36708083 (g) We would now like to determine year-over-year percentage change in population for the different age groups. Write a function called percentage_change (), which takes two parameters, one is a 2D array (containing the population data) and the other one is an integer which refers to a row index in the 2D array, and calculate the year-over-year percentage change of the age group at the given row index In this question, you will use information from Statistics Canada to analyse percentage changes of Canada national population grouped by ages from year 2013 to year 2017. On Moodle, you will find a CSV file age_statistics.csv with all the information that you require. Also, a starter python file a6q1_starter.py is provided. Write your assignment based on the given starter file The provided starter file opens the CSV file and reads the data it contains. You can just run the starter file to take a look at the data. You can see that the CSV file is a tabular file with commas for delimiters (if you want a better view of what the data in the CSV file looks like, open it in Excel, OpenOffice, or similar spreadsheet program; this will nicely visualize the data in columns for you) To complete the assignment, do the following (a) To analyze data in a file, you first need to separate the data ines/rows from the header lines/rows. If you examine the CSV file, you'll see that first actual data row is the 10th row. Write python code to extract only these data rows from the variable data and assign the result to a variable datai (b) As you can see, the first "column" of data in data1 gives the age group as a string, e.g. "O to 4 years". We do not need this column for our analysis. Write python code to remove the data in the first"column". convert all of the remaining data to integers (instead of strings), and assign the result to the variable data2 (c) Although we don't want the age group strings in the data that we will use for computation, we still want to refer back to them when we want to output the result of our analysis. Write python code to define a dictionary row age dct mapping the row index to age group strings. The dictionary should ook like: t0 0 to 4 years', 1: '5 to 9 years', 2: 10 to 14 years' 3: 15 to 19 years', 4: '20 to 24 years', 5: 25 to 29 years', 6 30 to 34 years, 7: '35 to 39 years', 8: 40 to 44 years' 9: 45 to 49 years', 10: ' 50 to 54 years', 11: '55 to 59 years', 12: 60 to 64 years', 13: 65 to 69 years', 14: '70 to 74 years, 15: 75 to 79 years', 16: 80 to 84 years', 17: '85 to 89 years', 18 '90 to 94 years', 19: '95 to 99 years', 20: '100 years and over'] (d) Convert the list data2 to a 2D numpy array and assign the result ot the variable data_array (e) We know that numpy arrays have some commonly used attributes such as the number of dimensions shape, size and the data type of an array. Print out these 4 attributes of the array data_array (f) Now let's do a little bit of calculation on the array data_array. Note that the columns of data that we retained are the population for each age group for the years 2013 through 2017. Use the sum() method defined in numpy module (not the built-in sum ) function) to get the total population of each year (sum over all age groups), and print them out to the console. You can use help (np. sum) to check how to use this function to get the results required here. You should print out something like this: The total population in year 2013 is 35152370 The total population in year 2014 is 35535348 The total population in year 2015 is 35832513 The total population in year 2016 is 36264604 The total population in year 2017 is 36708083 (g) We would now like to determine year-over-year percentage change in population for the different age groups. Write a function called percentage_change (), which takes two parameters, one is a 2D array (containing the population data) and the other one is an integer which refers to a row index in the 2D array, and calculate the year-over-year percentage change of the age group at the given row index
Step by Step Solution
There are 3 Steps involved in it

Get step-by-step solutions from verified subject matter experts