

Question: Computing, Disaggregating, and Analyzing Return on Equity Selected balance sheet and income statement information follows for Golden Eagle Inc. and Amber & Fish Co. Golden
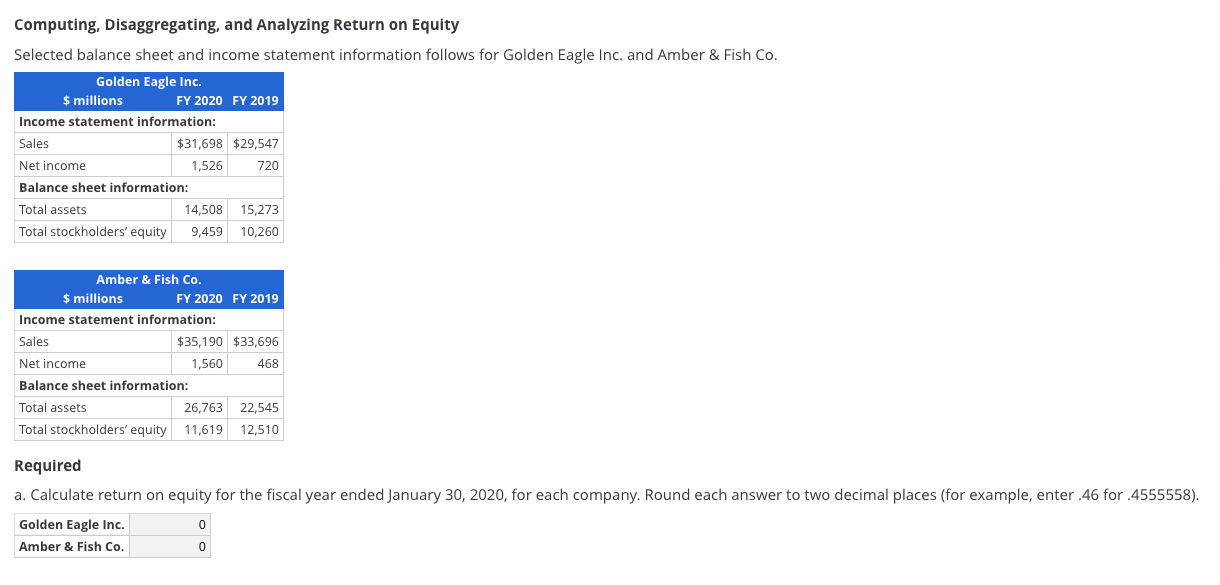
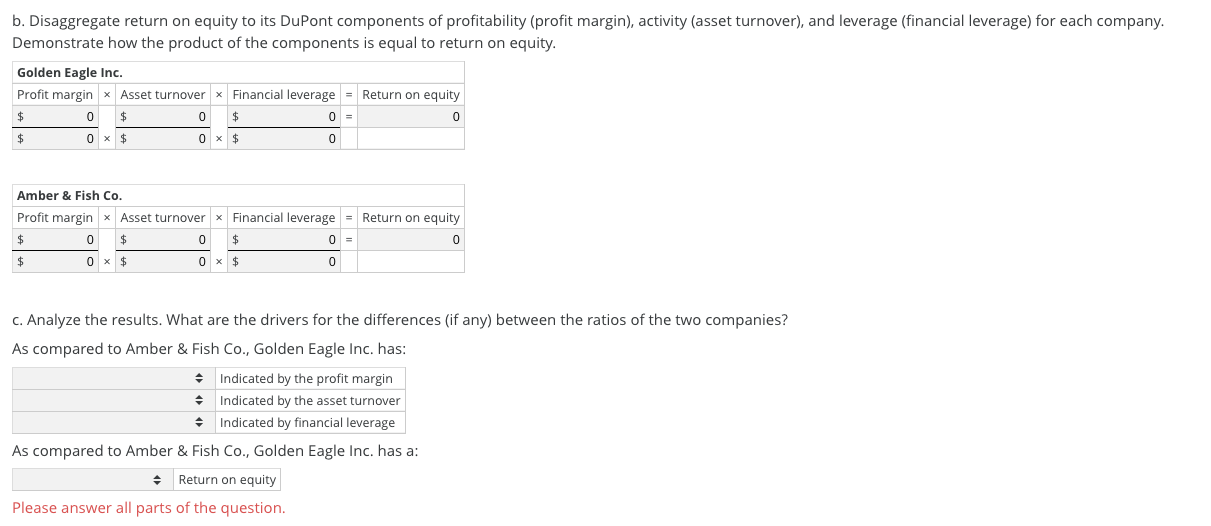
Computing, Disaggregating, and Analyzing Return on Equity Selected balance sheet and income statement information follows for Golden Eagle Inc. and Amber & Fish Co. Golden Eagle Inc. $ millions FY 2020 FY 2019 Income statement information: Sales $31,698 $29,547 Net income 1,526 720 Balance sheet information: Total assets 14,508 15,273 Total stockholders' equity 9,459 10,260 Amber & Fish Co. $ millions FY 2020 FY 2019 Income statement information: Sales $35,190 $33,696 Net income 1,560 468 Balance sheet information: Total assets 26,763 22,545 Total stockholders' equity 11,619 12,510 Required a. Calculate return on equity for the fiscal year ended January 30, 2020, for each company. Round each answer to two decimal places (for example, enter 46 for .4555558). 0 Golden Eagle Inc. Amber & Fish Co. 0 b. Disaggregate return on equity to its DuPont components of profitability (profit margin), activity (asset turnover), and leverage (financial leverage) for each company. Demonstrate how the product of the components is equal to return on equity. Golden Eagle Inc. Profit margin * Asset turnover * Financial leverage - Return on equity $ 0 $ 0 = 0 0 $ 0 x $ $ 0 x $ 0 Amber & Fish Co. Profit margin * Asset turnover * Financial leverage $ 0 0 0 = $ 0 x $ 0 x $ 0 Return on equity 0 C. Analyze the results. What are the drivers for the differences (if any) between the ratios of the two companies? As compared to Amber & Fish Co., Golden Eagle Inc. has: Indicated by the profit margin Indicated by the asset turnover Indicated by financial leverage As compared to Amber & Fish Co., Golden Eagle Inc. has a: Return on equity Please answer all parts of the
Step by Step Solution
There are 3 Steps involved in it

Get step-by-step solutions from verified subject matter experts