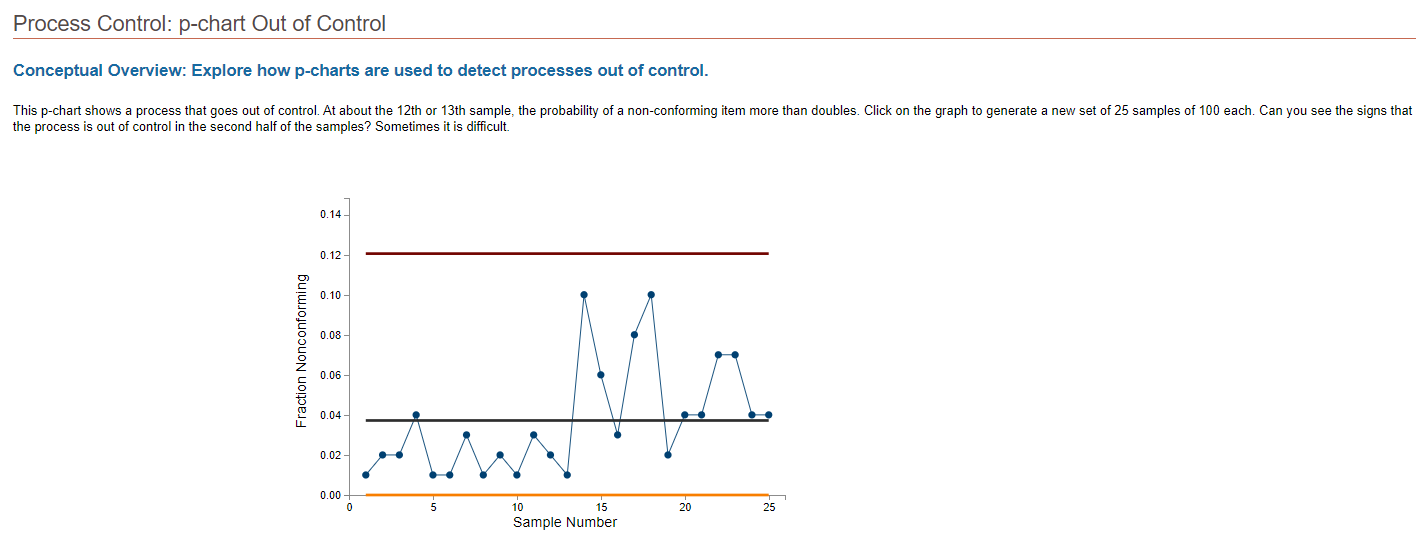
Question: Conceptual Overview: Explore how p-charts are used to detect processes out of control. the process is out of control in the second half of the

Conceptual Overview: Explore how p-charts are

Conceptual Overview: Explore how p-charts are

Conceptual Overview: Explore how p-charts are used to detect processes out of control. the process is out of control in the second half of the samples? Sometimes it is difficult. 1. In these p-chart examples, which of the following is most accurate? a. The process is not in control because there are several points that exceed the upper limit line. b. The process is not in control because the first half of the points are generally below the center line, while the second half are generally above the center line. c. The process is not in control because the points tend to trend lower from left to right. d. The process is not in control because several points are less than the lower limit line. 2. In these p-chart examples, which of the following behaviors indicates of a out-of-control process? a. The points appear to be randomly above and below the center line. b. Several points in a consecutive sequence are above the center line. c. Several points exceed the limit lines. d. The points are trending lower from left to right

Step by Step Solution

There are 3 Steps involved in it

1 Expert Approved Answer
Step: 1 Unlock blur-text-image
Question Has Been Solved by an Expert!

Get step-by-step solutions from verified subject matter experts

Step: 2 Unlock
Step: 3 Unlock

Students Have Also Explored These Related General Management Questions!