

Question: Conduct a sensitivity analysis for each variable and range and compute the NPV for each. Use Spreadsheet 10.1 and accompanying data as a starting point
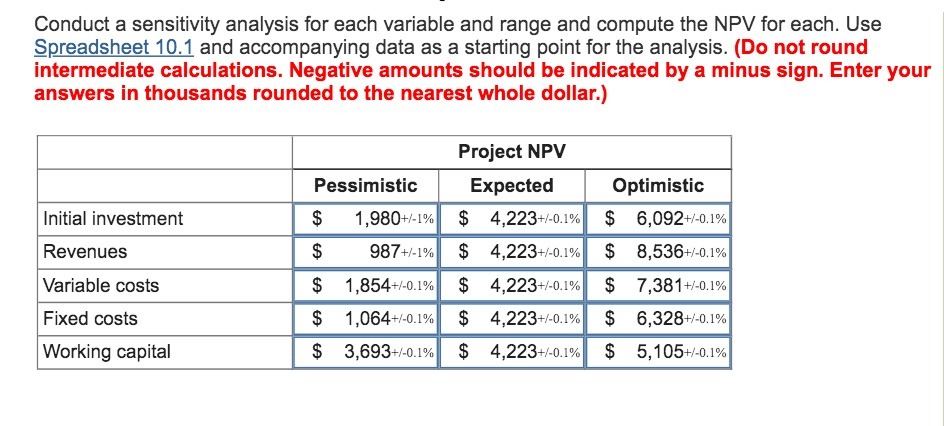
Conduct a sensitivity analysis for each variable and range and compute the NPV for each. Use Spreadsheet 10.1 and accompanying data as a starting point for the analysis. (Do not round intermediate calculations. Negative amounts should be indicated by a minus sign. Enter your answers in thousands rounded to the nearest whole dollar.) Project NPV Pessimistic Expected Optimistic Initial investment 1,980+/-1% $ 4,223+/-0.1% $ 6,092+/-0.1% Revenues 987+/-1% $ 4,223+/-0.1% $ 8,536+/-0.1% Variable costs 1,854+/-0.1% $ 4,223+/-0.1% $ 7,381+/-0.1% Fixed costs 1,064+/-0.1% $ 4,223+/-0.1% $ 6,328+/-0.1% Working capital $ 3,693+/-0.1% $ 4,223+/-0.1% $ 5,105+/-0.1%
Step by Step Solution
There are 3 Steps involved in it

Get step-by-step solutions from verified subject matter experts