

Question: conduct the hypothesis test and provide Conduct the hypothesis test and provide the test statistic and the critical value, and state the conclusion. A company
conduct the hypothesis test and provide
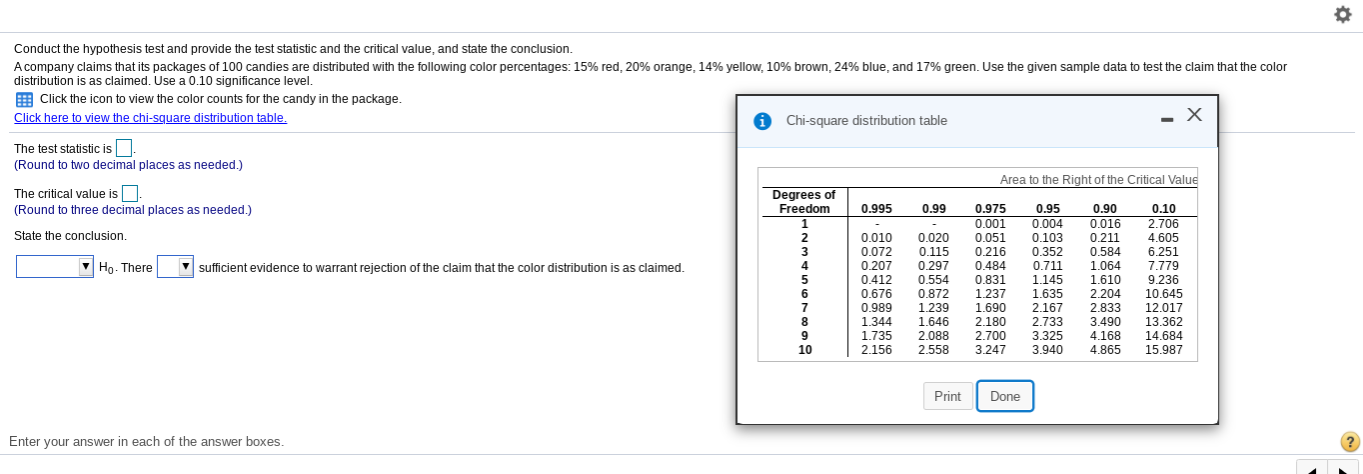
Conduct the hypothesis test and provide the test statistic and the critical value, and state the conclusion. A company claims that its packages of 100 candies are distributed with the following color percentages: 15% red, 20% orange, 14% yellow, 10% brown, 24% blue, and 17% green. Use the given sample data to test the claim that the color distribution is as claimed. Use a 0.10 significance level. Click the icon to view the color counts for the candy in the package. Click here to view the chi-square distribution table. i Chi-square distribution table X The test statistic is. (Round to two decimal places as needed.) Area to the Right of the Critical Value The critical value is. Degrees of (Round to three decimal places as needed.) Freedom 0.995 0.99 0.975 0.95 0.90 0.10 0.001 0.004 0.016 2.706 State the conclusion. 0.010 0.020 0.051 0.103 0.211 4.605 0.072 0.115 0.216 0.352 0.584 6.251 Ho- There sufficient evidence to warrant rejection of the claim that the color distribution is as claimed. 0.207 0.297 0.484 0.711 1.064 7.779 0.412 0.554 0.831 1.145 1.610 9.236 0.676 0.872 1.237 1.635 2.204 10.645 0.989 1.239 1.690 2.167 2.833 12.017 1.344 1.646 2.180 3.490 1.735 2.733 13.362 10 2.156 2.088 2.700 3.325 4.168 14.684 2.558 3.247 3.940 4.865 15.987 Print Done Enter your answer in each of the answer boxes.
Step by Step Solution
There are 3 Steps involved in it

Get step-by-step solutions from verified subject matter experts