

Question: Conduct the hypothesis test and provide the test statistic and the critical?value, and state the conclusion. A company claims that its packages of 100 candies
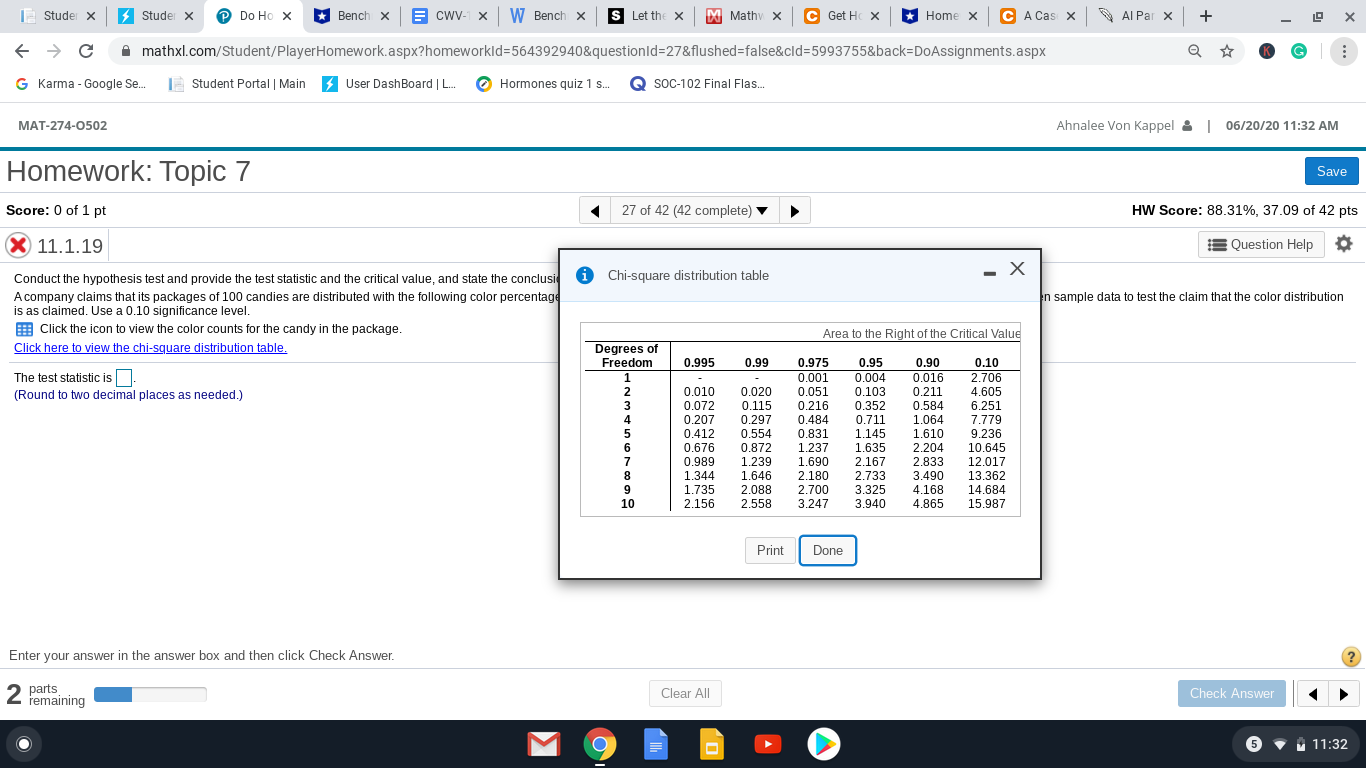
Conduct the hypothesis test and provide the test statistic and the critical?value, and state the conclusion.
A company claims that its packages of 100 candies are distributed with the following color?percentages: 15
15?% ?red, 20
20?% ?orange, 16
16?% ?yellow, 8
8?% ?brown, 25
25?% ?blue, and 16
16?% green. Use the given sample data to test the claim that the color distribution is as claimed. Use a 0.10
0.10 significance level.
The test statistic is... (Round to two decimal places as needed.)
The critical value is... (Round to three decimal places as needed.)
The P-value is... (Round to three decimal places as needed.)
State the conclusion. Do no reject OR Reject H0. There is OR is not sufficient evidence to warrant rejection of the claim that the color distribution is as claimed.
1Studer X Studer X Do Ho X Bench x = CWV-1 x W Bench x S Let the X D Mathv x C Get HC X * Home x C A Cas X Al Par X + X C mathxl.com/Student/PlayerHomework.aspx?homeworkld=564392940&questionld=27&flushed=false&cld=5993755&back=DoAssignments.aspx Q K G G Karma - Google Se. Student Portal | Main |User DashBoard | L.. @ Hormones quiz 1 s... Q SOC-102 Final Flas. MAT-274-0502 Ahnalee Von Kappel & | 06/20/20 11:32 AM Homework: Topic 7 Save Score: 0 of 1 pt 27 of 42 (42 complete) HW Score: 88.31%, 37.09 of 42 pts X 11.1.19 Question Help Conduct the hypothesis test and provide the test statistic and the critical value, and state the conclusi i Chi-square distribution table - X A company claims that its packages of 100 candies are distributed with the following color percentage n sample data to test the claim that the color distribution is as claimed. Use a 0.10 significance level. Click the icon to view the color counts for the candy in the package. Area to the Right of the Critical Value Click here to view the chi-square distribution table. Degrees of Freedom 0.995 0.99 0.975 0.95 0.90 0.10 The test statistic is. CO NG UA WNI 0.001 0.004 0.016 2.706 (Round to two decimal places as needed.) 0.010 0.020 0.051 0.103 0.211 4.605 0.072 0.115 0.216 0.352 0.584 6.251 0.207 0.297 0.484 0.711 1.064 7.779 0.412 0.554 0.831 1.145 1.610 9.236 0.676 0.872 1.237 1.635 2.204 10.645 0.989 1.239 1.690 2.167 2.833 12.017 1.344 1.646 2.180 2.733 13.362 1.735 2.088 3.490 2.700 3.325 4.168 14.684 2.156 2.558 3.247 3.940 4.865 15.987 Print Done Enter your answer in the answer box and then click Check Answer. ? 2 parts remaining Clear All Check Answer M 5 11:32
Step by Step Solution
There are 3 Steps involved in it

Get step-by-step solutions from verified subject matter experts