

Question: Conduct the hypothesis test and provide the test statistic, critical value and P-value, and state the conclusion.A package of 100 candies are distributed with the
Conduct the hypothesis test and provide the test statistic, critical value and P-value, and state the conclusion.A package of 100 candies are distributed with the following color percentages: 15% red, 19% orange, 15% yellow, 14% brown, 22% blue, and 15% green. Use the given sample data to test the claim that the color distribution is as claimed. Use a 0.01 significance level.
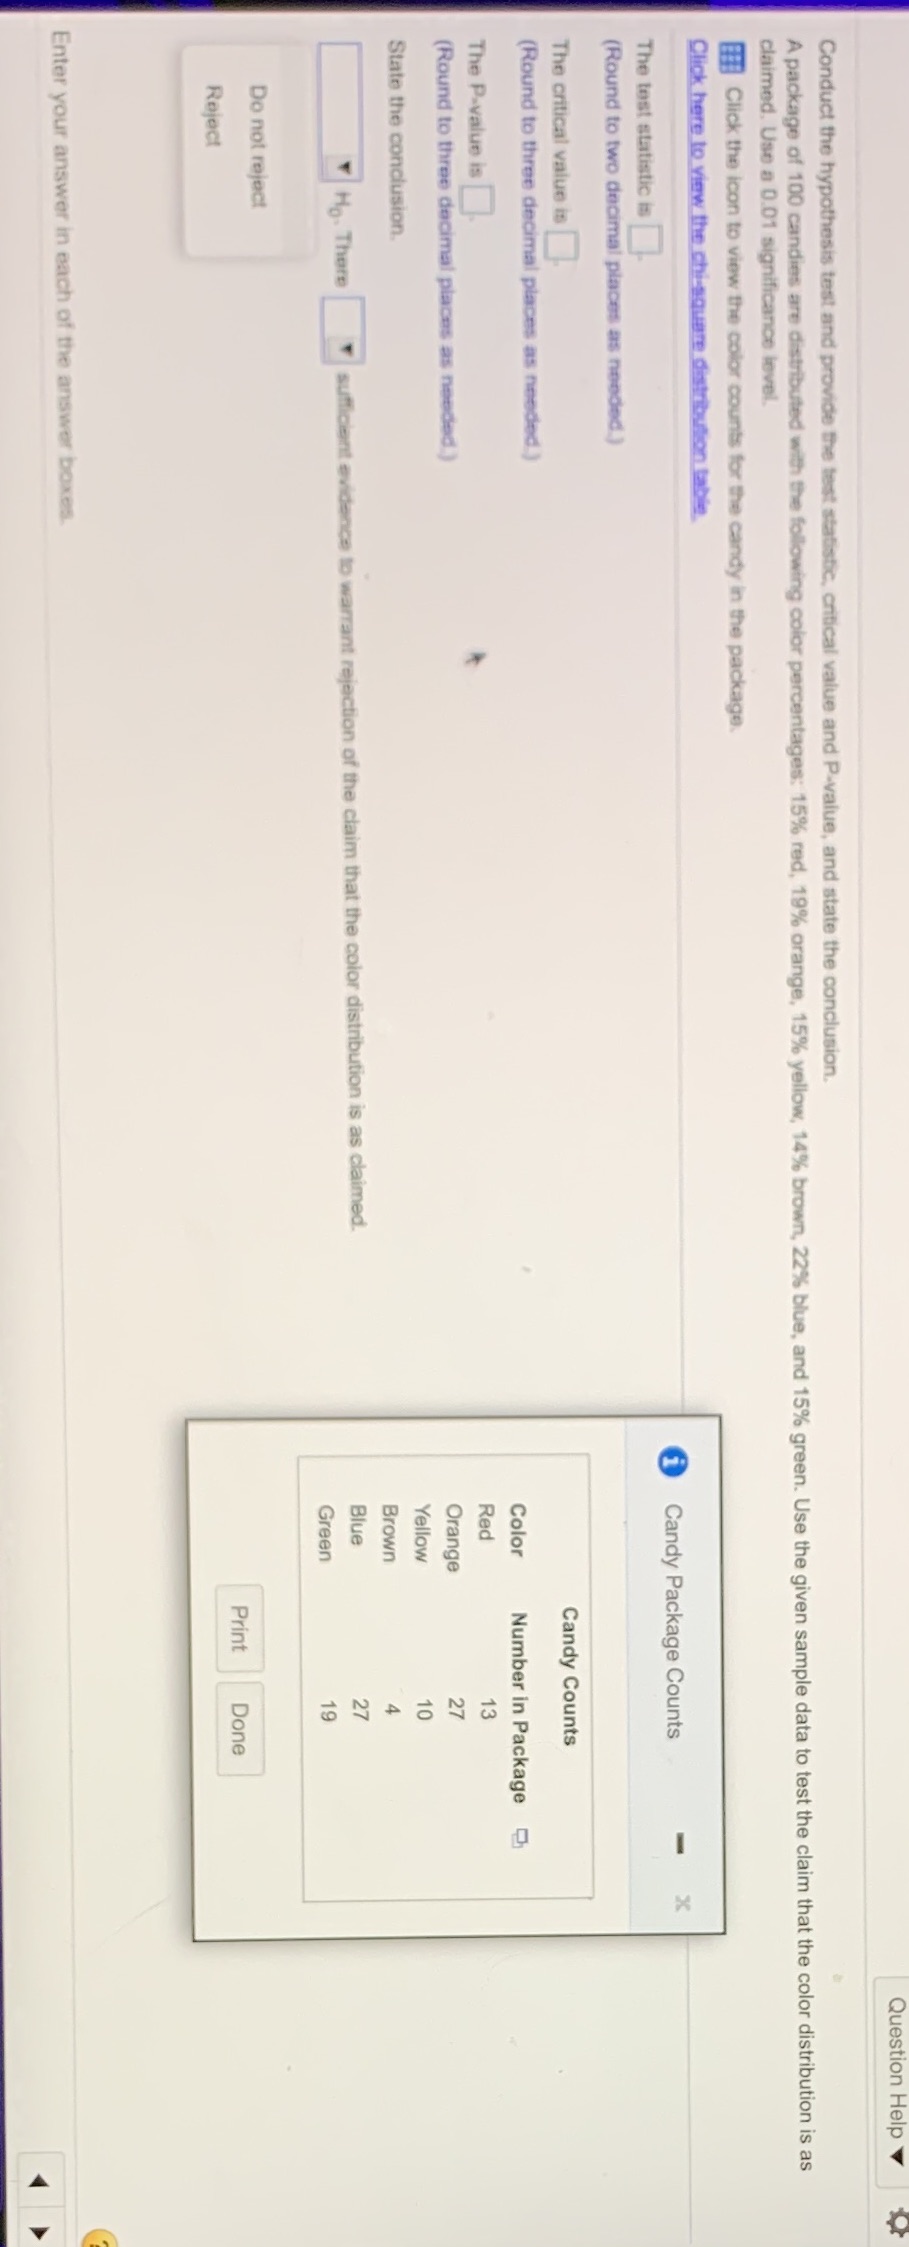
Conduct the hypothesis test and critical value and P-value, and state the conclusion. A package of 100 candies are distributed with the following color percentages: 15% red, 19% orange, 15% yellow, 14% brown, 22% blue, and 15% green. Use the given sample data to test the claim that the color distribution is as claimed. Use a 0.01 significance level. Ff Click the icon to view the color counts for the candy in the package. Click here to view the chi-aquare distribution table. Candy Package Counts X The test statistic is (Round to two decimal places as needed.) The critical value is Candy Counts (Round to three decimal places as needed Color Number in Package The P.value is Red (Round to three decimal places as needed Orange Yellow State the conclusion. Brown |Ho. There to warrant rejection of the claim that the color distribution is as claimed. Blue Green Do not reject Print Done Reject Enter your answer in each of the answer boxes
Step by Step Solution
There are 3 Steps involved in it

Get step-by-step solutions from verified subject matter experts