

Question: Consider a pressure versus volume graph, where the different curves represent different processes done on a gas. Starting at the origin to point 1, the
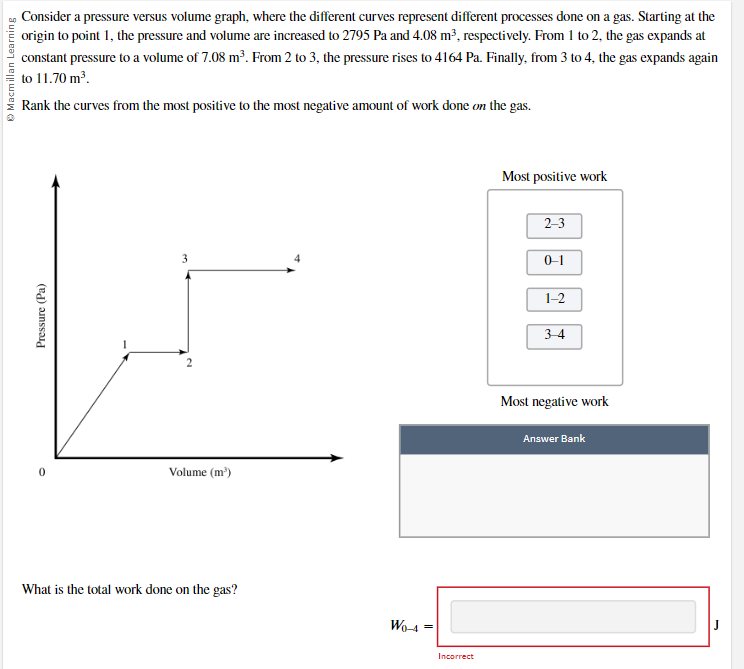
Consider a pressure versus volume graph, where the different curves represent different processes done on a gas. Starting at the origin to point 1, the pressure and volume are increased to 2795 Pa and 4.08 ma, respectively. From 1 to 2, the gas expands at constant pressure to a volume of 7.08 ma. From 2 to 3, the pressure rises to 4164 Pa. Finally, from 3 to 4, the gas expands again Macmillan Learning to 11.70 m'. Rank the curves from the most positive to the most negative amount of work done on the gas. Most positive work 2-3 0-1 1-2 Pressure (Pa) 34 2 Most negative work Answer Bank Volume (m') What is the total work done on the gas? WO-4 = Incorrect
Step by Step Solution
There are 3 Steps involved in it

Get step-by-step solutions from verified subject matter experts