

Question: Consider an IEEE 9 bus power grid with generators located at nodes 1 , 2 and 3 . The loads demand is located at nodes
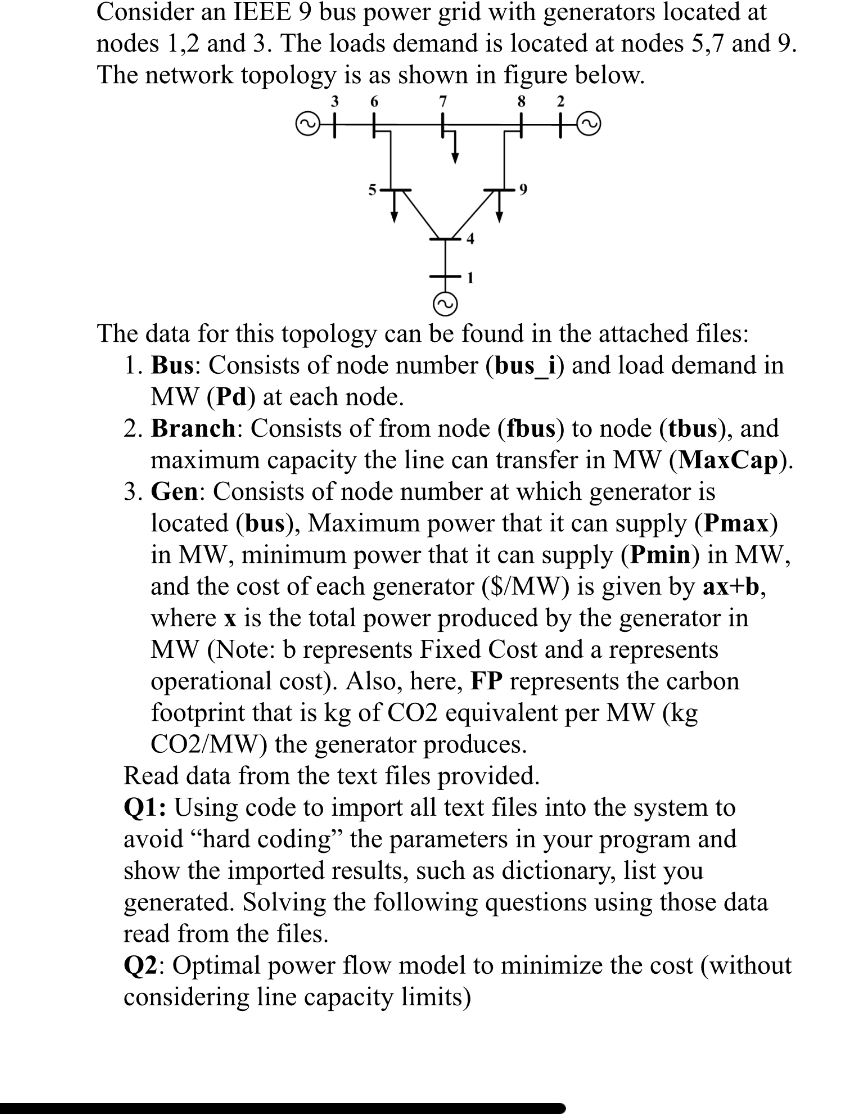
Consider an IEEE bus power grid with generators located at nodes and The loads demand is located at nodes and The network topology is as shown in figure below.
The data for this topology can be found in the attached files:
Bus: Consists of node number busi and load demand in MW Pd at each node.
Branch: Consists of from node fbus to node tbus and maximum capacity the line can transfer in MW MaxCap
Gen: Consists of node number at which generator is located bus Maximum power that it can supply Pmax in MW minimum power that it can supply Pmin in MW and the cost of each generator $MW is given by where is the total power produced by the generator in MW Note: b represents Fixed Cost and a represents operational cost Also, here, FP represents the carbon footprint that is kg of CO equivalent per the generator produces.
Read data from the text files provided.
Q: Using code to import all text files into the system to avoid "hard coding" the parameters in your program and show the imported results, such as dictionary, list you generated. Solving the following questions using those data read from the files.
Q: Optimal power flow model to minimize the cost without considering line capacity limits
Step by Step Solution
There are 3 Steps involved in it
1 Expert Approved Answer
Step: 1 Unlock

Question Has Been Solved by an Expert!
Get step-by-step solutions from verified subject matter experts
Step: 2 Unlock
Step: 3 Unlock