

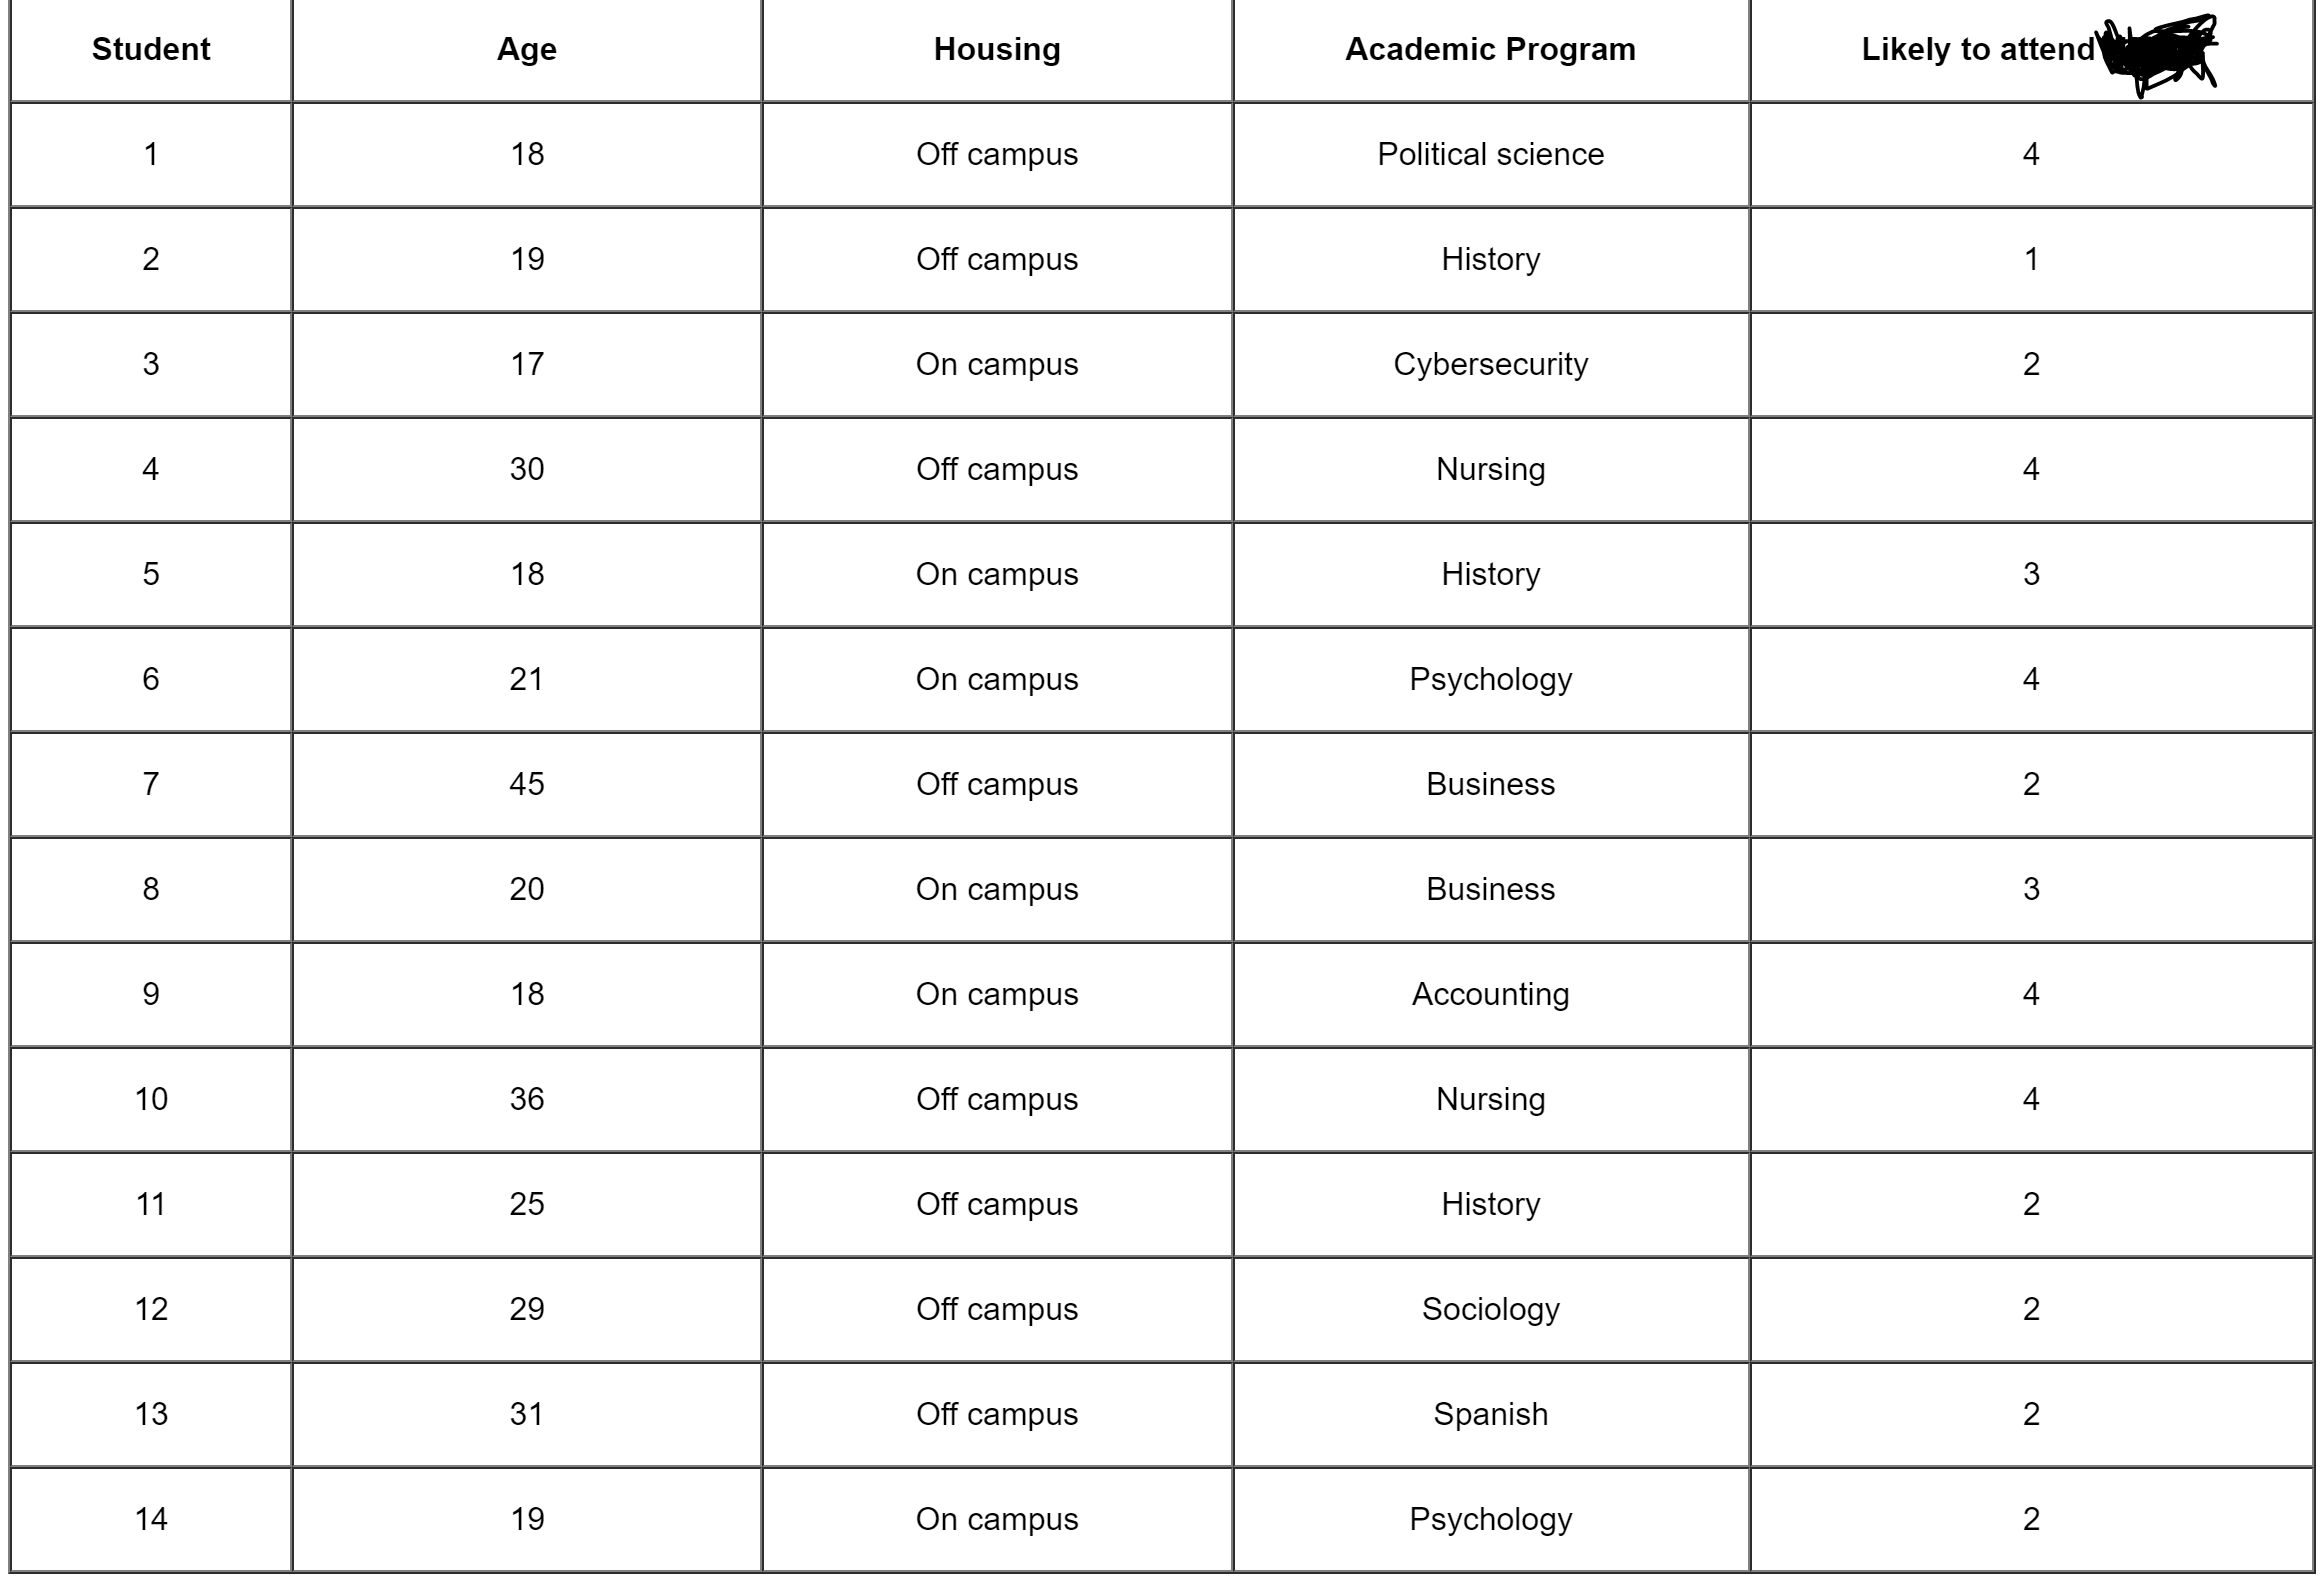
Question: Consider how you might visually display the results as a graph (bar graph, Pareto chart, dot plot, line graph, histogram, pie chart, or box plot).Why
Consider how you might visually display the results as a graph (bar graph, Pareto chart, dot plot, line graph, histogram, pie chart, or box plot).Why did you choose this graph? Explain why you believe this graph is the best choice to display the data.
Step by Step Solution
There are 3 Steps involved in it
1 Expert Approved Answer
Step: 1 Unlock

Question Has Been Solved by an Expert!
Get step-by-step solutions from verified subject matter experts
Step: 2 Unlock
Step: 3 Unlock