

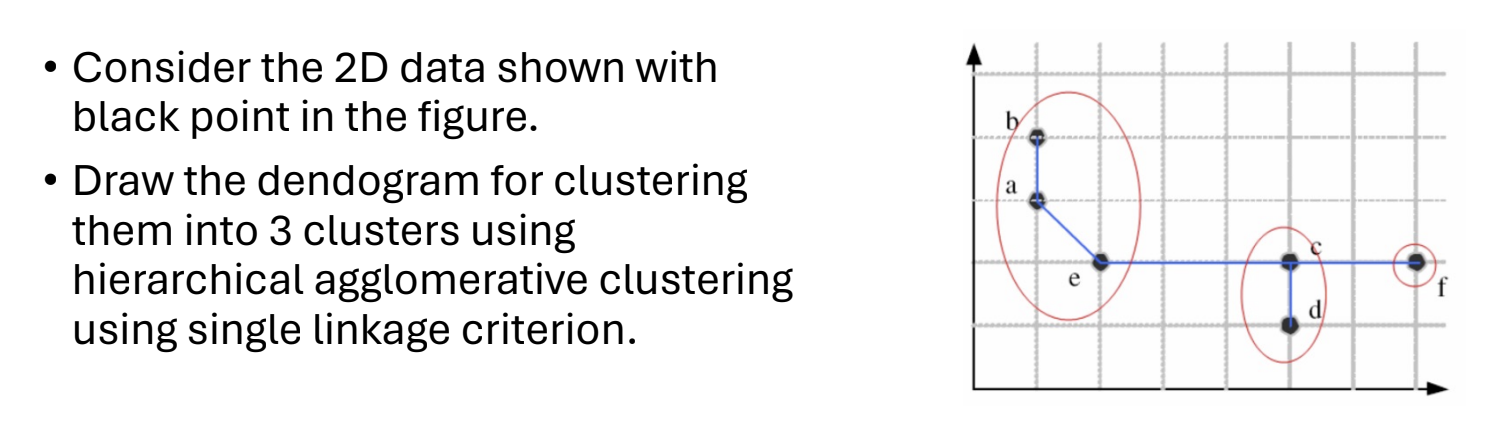
Question: Consider the 2 D data shown with black point in the figure. Draw the dendogram for clustering them into 3 clusters using hierarchical agglomerative clustering
Consider the D data shown with
black point in the figure.
Draw the dendogram for clustering
them into clusters using
hierarchical agglomerative clustering
using single linkage criterion.
Step by Step Solution
There are 3 Steps involved in it
1 Expert Approved Answer
Step: 1 Unlock

Question Has Been Solved by an Expert!
Get step-by-step solutions from verified subject matter experts
Step: 2 Unlock
Step: 3 Unlock