

Question: Consider the circuit shown in Figure 1 below, constructed with an ideal opamp. ( NOTE: Verification of your answers with LTSpice, Matlab, etc. is not
Consider the circuit shown in Figure below, constructed with an ideal opamp. NOTE: Verification of your answers with LTSpice, Matlab, etc. is not required for this assignment.
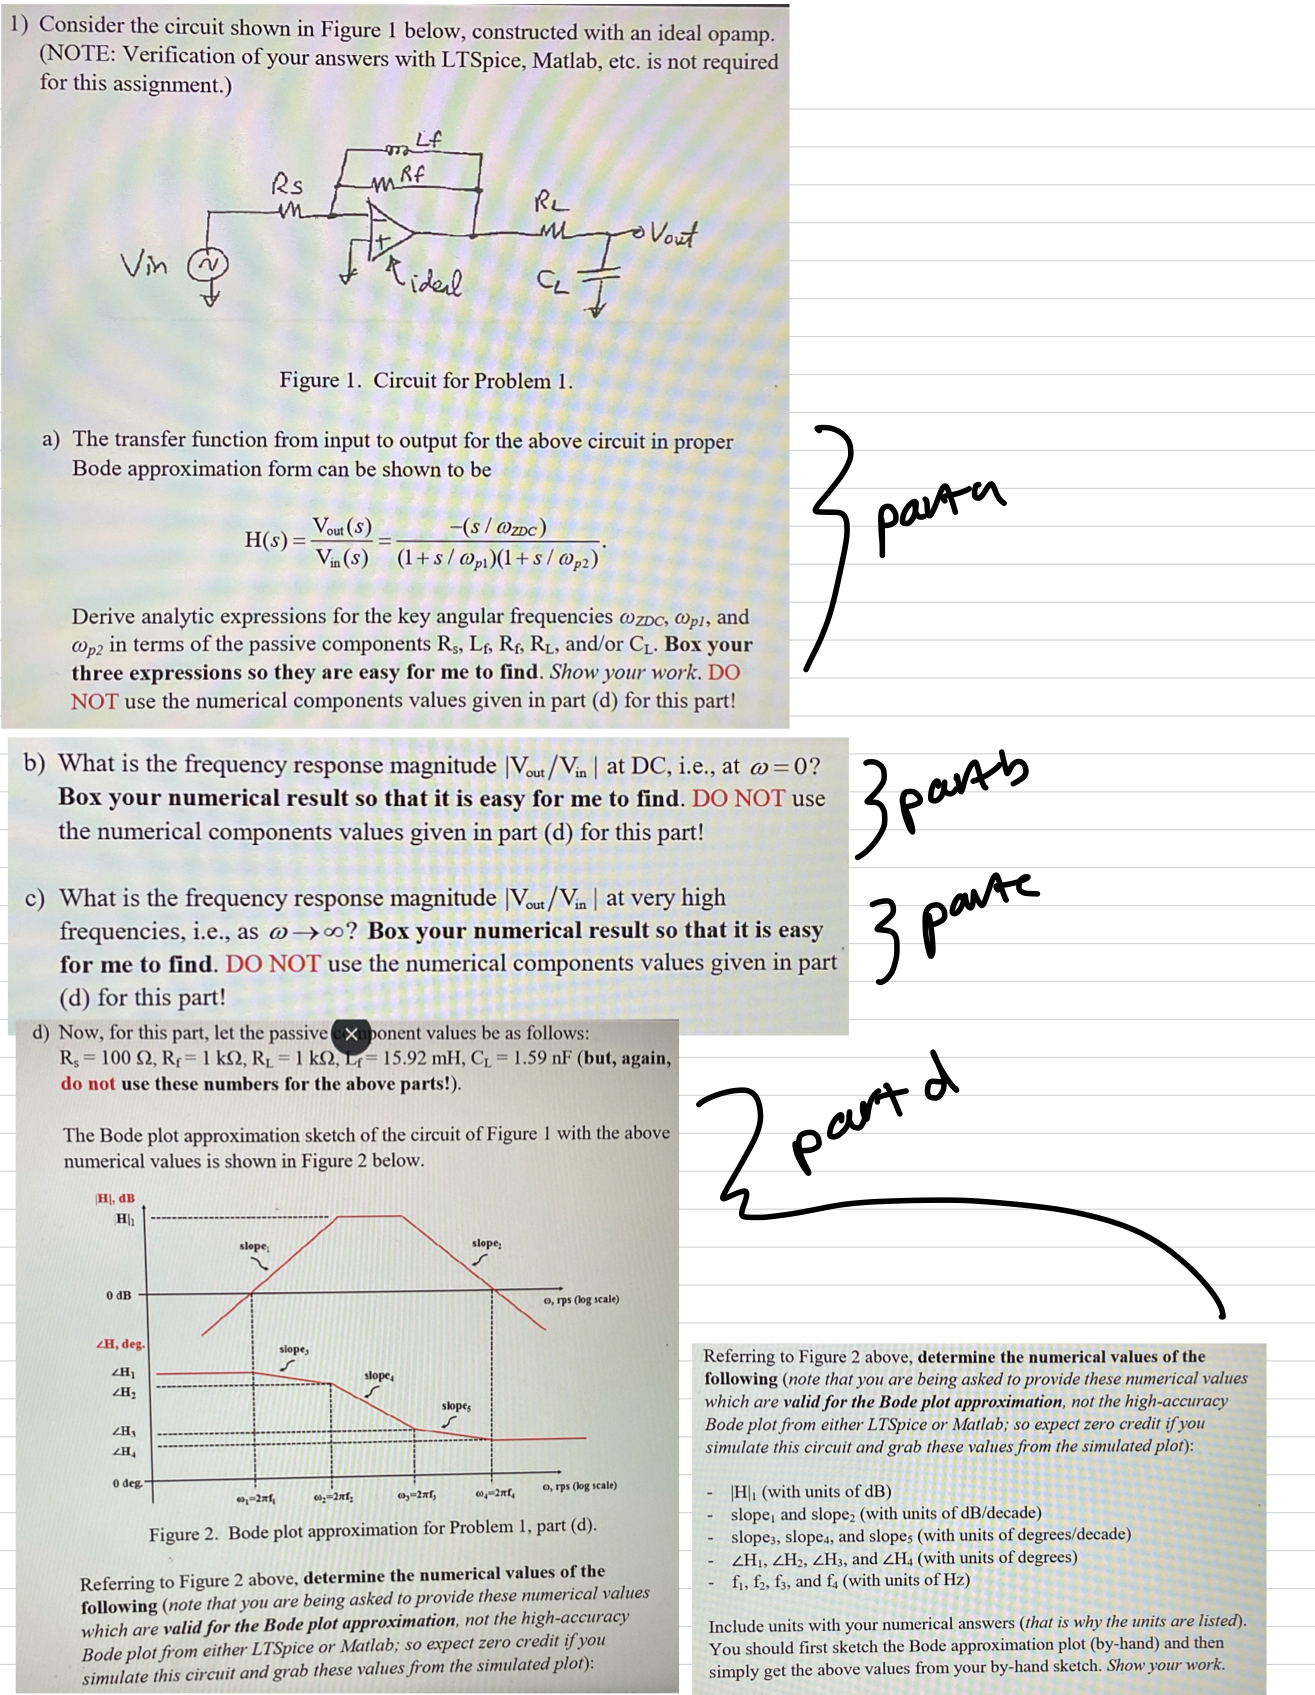
Figure Circuit for Problem
a The transfer function from input to output for the above circuit in proper Bode approximation form can be shown to be
Derive analytic expressions for the key angular frequencies and in terms of the passive components andor Box your three expressions so they are easy for me to find. Show your work. DO NOT use the numerical components values given in part d for this part!
b What is the frequency response magnitude at ie at Box your numerical result so that it is easy for me to find. DO NOT use the numerical components values given in part d for this part!
c What is the frequency response magnitude at very high frequencies, ie as Box your numerical result so that it is easy for me to find. DO NOT use the numerical components values given in part d for this part!
d Now, for this part, let the passive ponent values be as follows: but again, do not use these numbers for the above parts!
The Bode plot approximation sketch of the circuit of Figure with the above numerical values is shown in Figure below.
Figure Bode plot approximation for Problem part d
Referring to Figure above, determine the numerical values of the following note that you are being asked to provide these numerical values which are valid for the Bode plot approximation, not the highaccuracy Bode plot from either LTSpice or Matlab; so expect zero credit if you simulate this circuit and grab these values from the simulated plot:
Referring to Figure above, determine the numerical values of the following note that you are being asked to provide these numerical values which are valid for the Bode plot approximation, not the highaccuracy Bode plot from either LTSpice or Matlab; so expect zero credit if you simulate this circuit and grab these values from the simulated plot:
with units of dB
slope and slope with units of decade
slope slope and slope with units of degreesdecade
and with units of degrees
and with units of Hz
Include units with your numerical answers that is why the units are listed You should first sketch the Bode approximation plot byhand and then simply get the above values from your byhand sketch. Show your work.
Step by Step Solution
There are 3 Steps involved in it
1 Expert Approved Answer
Step: 1 Unlock

Question Has Been Solved by an Expert!
Get step-by-step solutions from verified subject matter experts
Step: 2 Unlock
Step: 3 Unlock