

Question: Consider the data from the lecture notes on the US, UK and Japanese stock market; Means: St. Dev. US UK Japan US 0.1355 0.1535
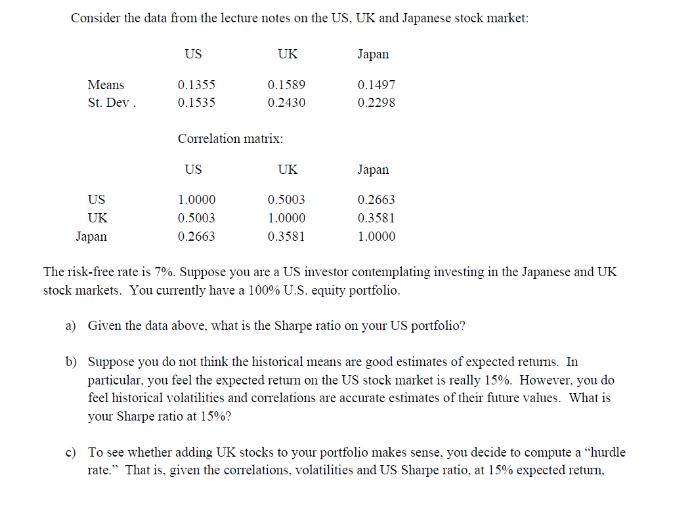
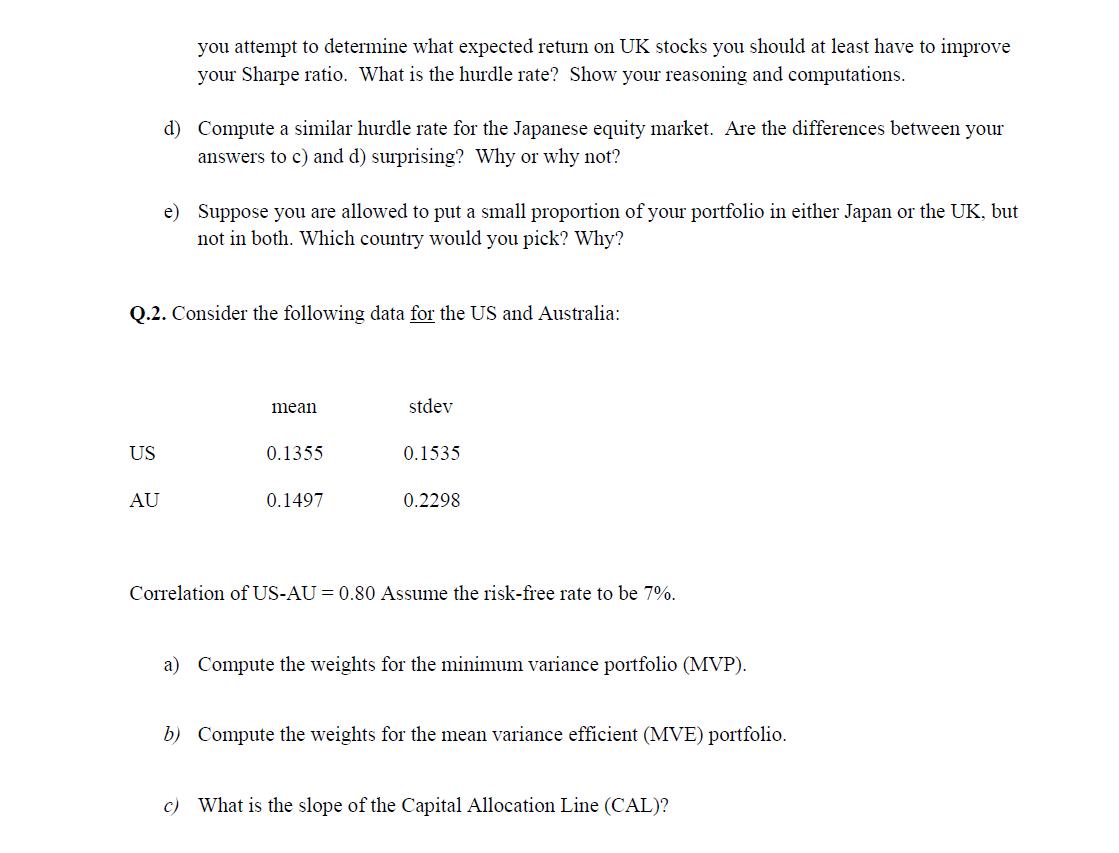
Consider the data from the lecture notes on the US, UK and Japanese stock market; Means: St. Dev. US UK Japan US 0.1355 0.1535 UK 0.1589 0.2430 Correlation matrix: US 1.0000 0.5003 0.2663 UK 0.5003 1.0000 0.3581 Japan 0.1497 0.2298 Japan 0.2663 0.3581 1.0000 The risk-free rate is 7%. Suppose you are a US investor contemplating investing in the Japanese and UK stock markets. You currently have a 100% U.S. equity portfolio. a) Given the data above, what is the Sharpe ratio on your US portfolio? b) Suppose you do not think the historical means are good estimates of expected returns. In particular, you feel the expected return on the US stock market is really 15%. However, you do feel historical volatilities and correlations are accurate estimates of their future values. What is your Sharpe ratio at 15%? c) To see whether adding UK stocks to your portfolio makes sense, you decide to compute a "hurdle rate." That is, given the correlations, volatilities and US Sharpe ratio, at 15% expected return, US you attempt to determine what expected return on UK stocks you should at least have to improve your Sharpe ratio. What is the hurdle rate? Show your reasoning and computations. AU d) Compute a similar hurdle rate for the Japanese equity market. Are the differences between your answers to c) and d) surprising? Why or why not? Q.2. Consider the following data for the US and Australia: e) Suppose you are allowed to put a small proportion of your portfolio in either Japan or the UK, but not in both. Which country would you pick? Why? mean 0.1355 0.1497 stdev 0.1535 0.2298 Correlation of US-AU = 0.80 Assume the risk-free rate to be 7%. a) Compute the weights for the minimum variance portfolio (MVP). b) Compute the weights for the mean variance efficient (MVE) portfolio. c) What is the slope of the Capital Allocation Line (CAL)?
Step by Step Solution
There are 3 Steps involved in it
a To calculate the Sharpe ratio of the US portfolio we need the riskfree rate and the expected return and standard deviation of the portfolio The risk... View full answer

Get step-by-step solutions from verified subject matter experts