

Question: Consider the data in the Excel file Nuclear Power. Use simple linear regression to forecast the data. What would be the forecasts for the next
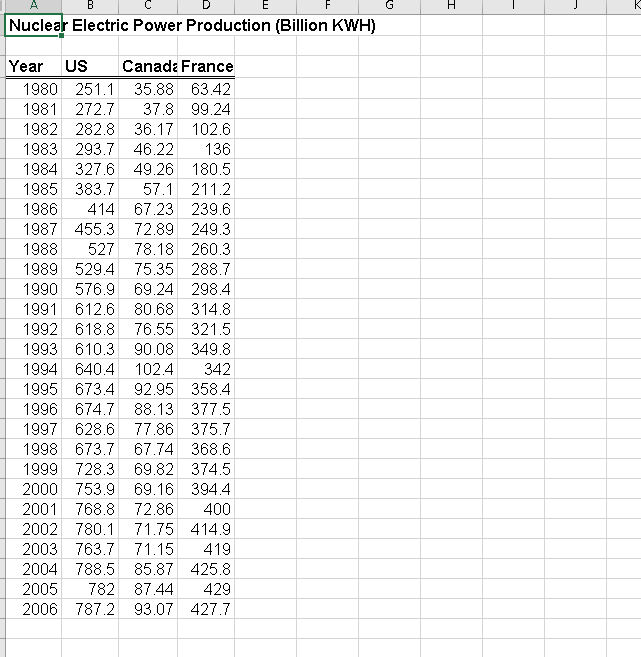
Consider the data in the Excel file Nuclear Power. Use simple linear regression to forecast the data. What would be the forecasts for the next three years? Nuclear Electric Power Production (Billion KWH) \begin{tabular}{|r|r|r|r|} \hline \multicolumn{1}{|l|}{ Year } & US & Canadz France \\ \hline \hline 1980 & 251.1 & 35.88 & 63.42 \\ \hline 1981 & 272.7 & 37.8 & 99.24 \\ \hline 1982 & 282.8 & 36.17 & 102.6 \\ \hline 1983 & 293.7 & 46.22 & 136 \\ \hline 1984 & 327.6 & 49.26 & 180.5 \\ \hline 1985 & 383.7 & 57.1 & 211.2 \\ \hline 1986 & 414 & 67.23 & 239.6 \\ \hline 1987 & 455.3 & 72.89 & 249.3 \\ \hline 1988 & 527 & 78.18 & 260.3 \\ \hline 1989 & 529.4 & 75.35 & 288.7 \\ \hline 1990 & 576.9 & 69.24 & 298.4 \\ \hline 1991 & 612.6 & 80.68 & 314.8 \\ \hline 1992 & 618.8 & 76.55 & 321.5 \\ \hline 1993 & 610.3 & 90.08 & 349.8 \\ \hline 1994 & 640.4 & 102.4 & 342 \\ \hline 1995 & 673.4 & 92.95 & 358.4 \\ \hline 1996 & 674.7 & 88.13 & 377.5 \\ \hline 1997 & 628.6 & 77.86 & 375.7 \\ \hline 1998 & 673.7 & 67.74 & 368.6 \\ \hline 1999 & 728.3 & 69.82 & 374.5 \\ \hline 2000 & 753.9 & 69.16 & 394.4 \\ \hline 2001 & 768.8 & 72.86 & 400 \\ \hline 2002 & 780.1 & 71.75 & 414.9 \\ \hline 2003 & 763.7 & 71.15 & 419 \\ \hline 2004 & 788.5 & 85.87 & 425.8 \\ \hline 2005 & 782 & 87.44 & 429 \\ \hline 2006 & 787.2 & 93.07 & 427.7 \\ \hline \end{tabular}
Step by Step Solution
There are 3 Steps involved in it

Get step-by-step solutions from verified subject matter experts