

Question: please help me. Thank you 15. Consider the data in the Excel file Nuclear Power. Use simple linear regression to forecast the data. What would

please help me. Thank you
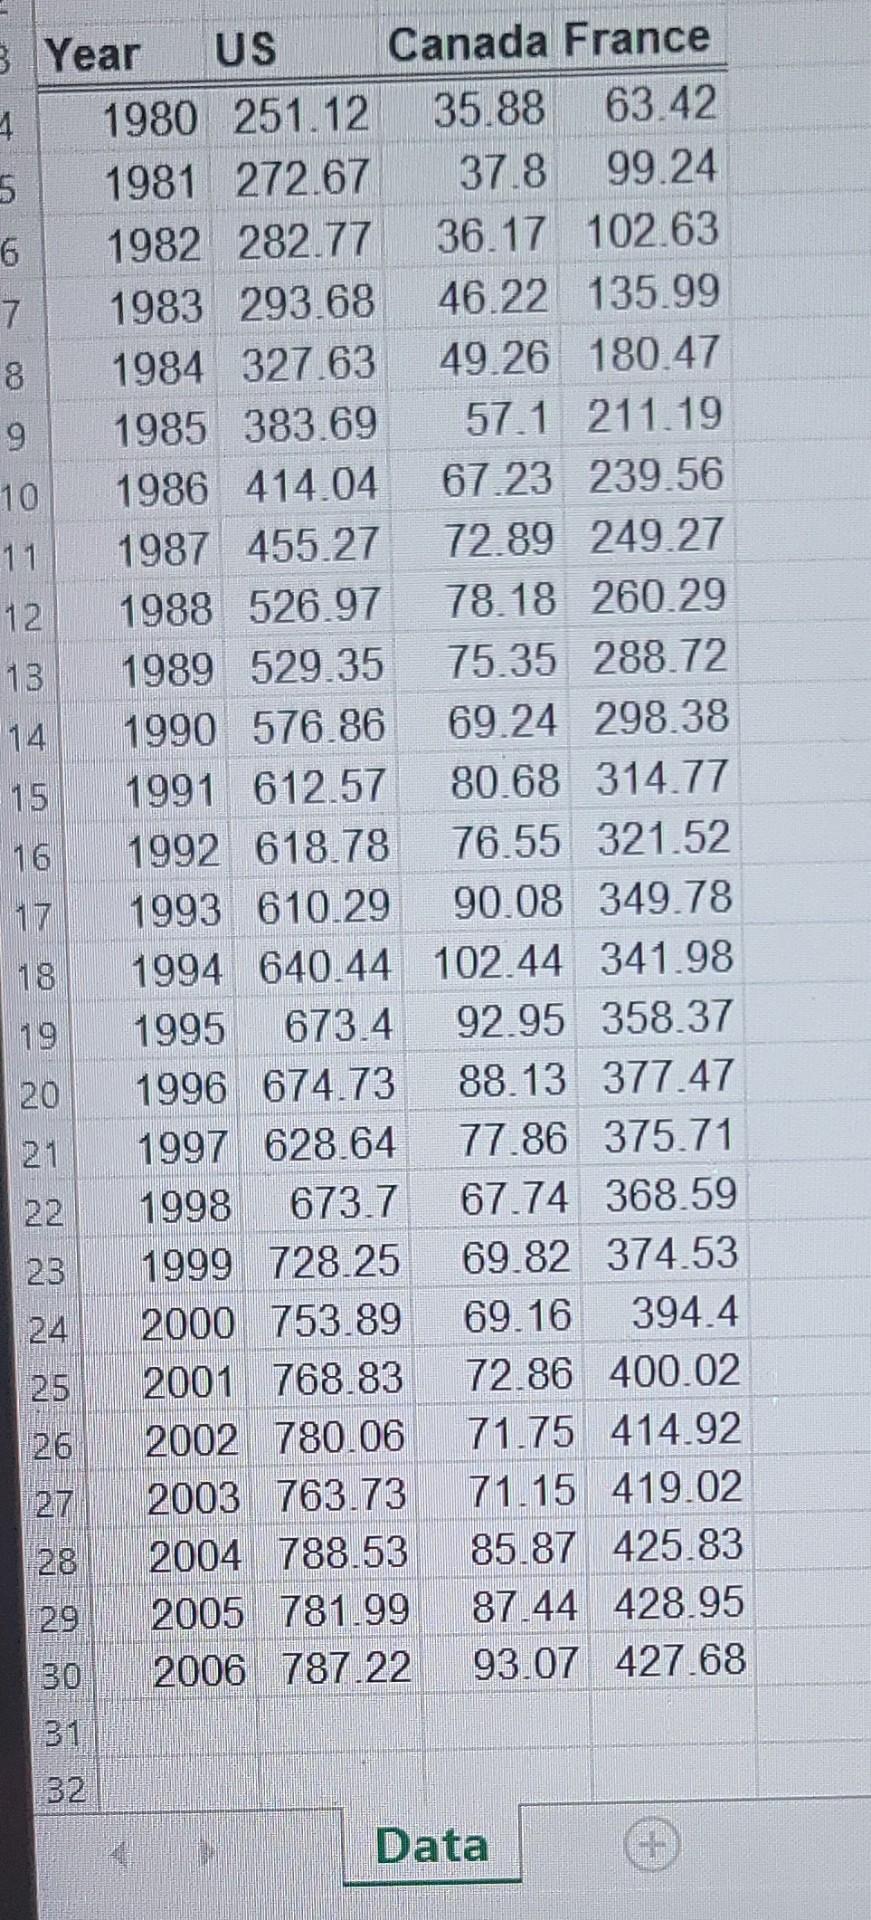
15. Consider the data in the Excel file Nuclear Power. Use simple linear regression to forecast the data. What would be the forecasts for the next three years? 3 Year US 4 5 6 7 8 9 10 1980 251.12 1981 272.67 1982 282.77 1983 293.68 1984 327.63 1985 383.69 1986 414.04 1987 455.27 1988 526.97 1989 529.35 14 1990 576.86 15 1991 612.57 16 1992 618.78 17 1993 610.29 90.08 349.78 18 1994 640.44 102.44 341.98 1995 19 673 4 92.95 358.37 20 1996 674.73 21 1997 628.64 11 12 13 N N N 23 24 25 Canada France 35.88 63.42 37.8 99.24 36.17 102.63 46.22 135.99 49.26 180.47 57.1 211.19 67.23 239.56 72.89 249.27 78.18 260.29 75.35 288.72 69.24 298.38 80.68 314.77 76.55 321.52 22 1998 673.7 27 29 30 31 32 88.13 377.47 77.86 375.71 67.74 368.59 1999 728.25 69.82 374.53 2000 753.89 69.16 394.4 2001 768.83 72.86 400.02 2002 780.06 71.75 414.92 2003 763.73 71.15 419.02 2004 788.53 85.87 425.83 2005 781.99 87.44 428.95 2006 787.22 93.07 427.68 DataStep by Step Solution
There are 3 Steps involved in it
1 Expert Approved Answer
Step: 1 Unlock

Question Has Been Solved by an Expert!
Get step-by-step solutions from verified subject matter experts
Step: 2 Unlock
Step: 3 Unlock