

Question: Consider the data in the image below that have been drawn from the American Citizen Participation Study of summer 1990. On that survey, people were
Consider the data in the image below that have been drawn from the American Citizen Participation Study of summer 1990. On that survey, people were asked whether or not they had volunteered their services for any civil society organizations. If someone answered yes he or she was asked the following question:
If you average across the last twelve months, about how many hours per week did you volunteer for all of those various organizations?
The data in the image below provides the distribution of responses to the question, which was then coded as a variable in the data. The first column of the table contains the number of hours reported. The second column contains the number of respondents reporting the value from the first column. (424 reported working 0 hours.) The third column contains the percentage of respondents giving a particular number. (31.81% of respondents reported working 0 hours.) The fourth column contains a cumulative percentage. (For example, examining the second row of the table, 47.11% of respondents reported working either 0 or 1 hours.)
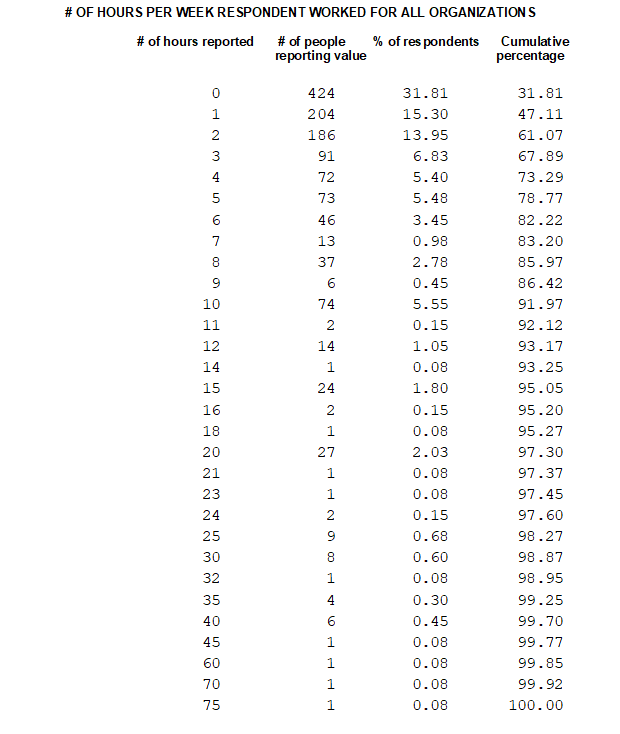
# OF HOURS PER WEEK RESPONDENT WORKED FOR ALL ORGANIZATIONS # of hours reported # of people % of respondents Cumulative reporting value percentage 424 31. 81 31 . 81 204 15.30 47 . 11 186 13.95 61 .07 91 6.83 67 .89 72 5.40 73.29 73 5.48 78 .77 46 3. 45 82.22 13 0. 98 83. 20 37 2. 78 85.97 6 0. 45 86.42 74 5.55 91 . 97 2 0. 15 92 . 12 14 1. 05 93 . 17 1 0. 08 93. 25 15 24 1.80 95 . 05 16 2 0. 15 95.20 18 1 0. 08 95.27 20 27 2.03 97.30 21 0. 08 97.37 23 0. 08 97 . 45 24 0. 15 97 . 60 25 0. 68 98 .27 30 0. 60 98 . 87 32 0. 08 98 . 95 HHHHOHOONPA 35 0. 30 99.25 40 0. 45 99.70 45 0. 08 99.77 60 0. 08 99 .85 70 0. 08 99 . 92 75 0. 08 100. 00
Step by Step Solution
There are 3 Steps involved in it

Get step-by-step solutions from verified subject matter experts