

Question: Consider the data on x and y shown in the table. (a) Fit the model E(y) = Bo + Bix to the data. (b)
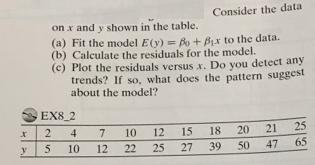
Consider the data on x and y shown in the table. (a) Fit the model E(y) = Bo + Bix to the data. (b) Calculate the residuals for the model. (c) Plot the residuals versus x. Do you detect any trends? If so, what does the pattern suggest about the model? EX8 2 2 4 7. 10 12 15 18 20 21 25 5 10 12 22 25 27 39 50 47 65
Step by Step Solution
★★★★★
3.54 Rating (151 Votes )
There are 3 Steps involved in it
1 Expert Approved Answer
Step: 1 Unlock

t 4 Fit the model E1 B Bix to the dorte 3D 1WAMASSNU 10 18026 31974 61846 32154 14257622S16 ... View full answer
Question Has Been Solved by an Expert!
Get step-by-step solutions from verified subject matter experts
Step: 2 Unlock
Step: 3 Unlock