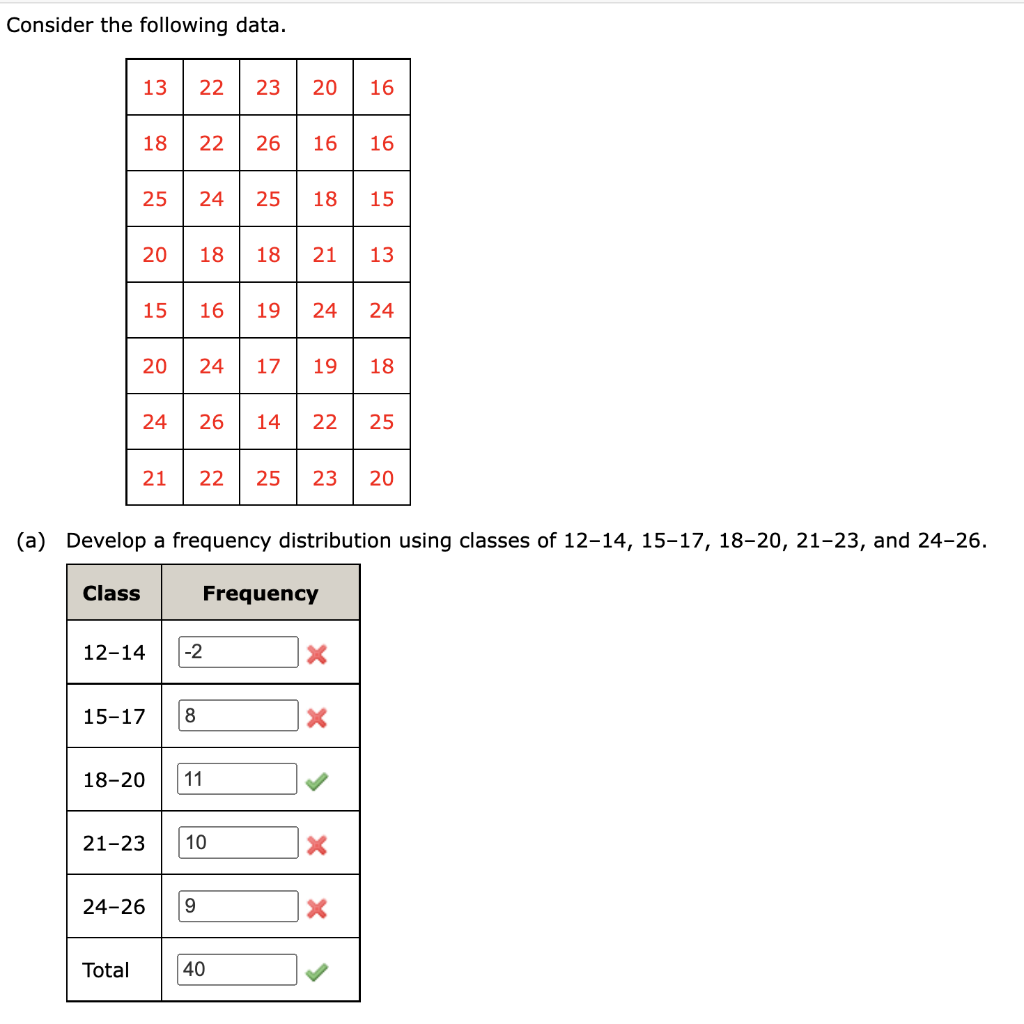
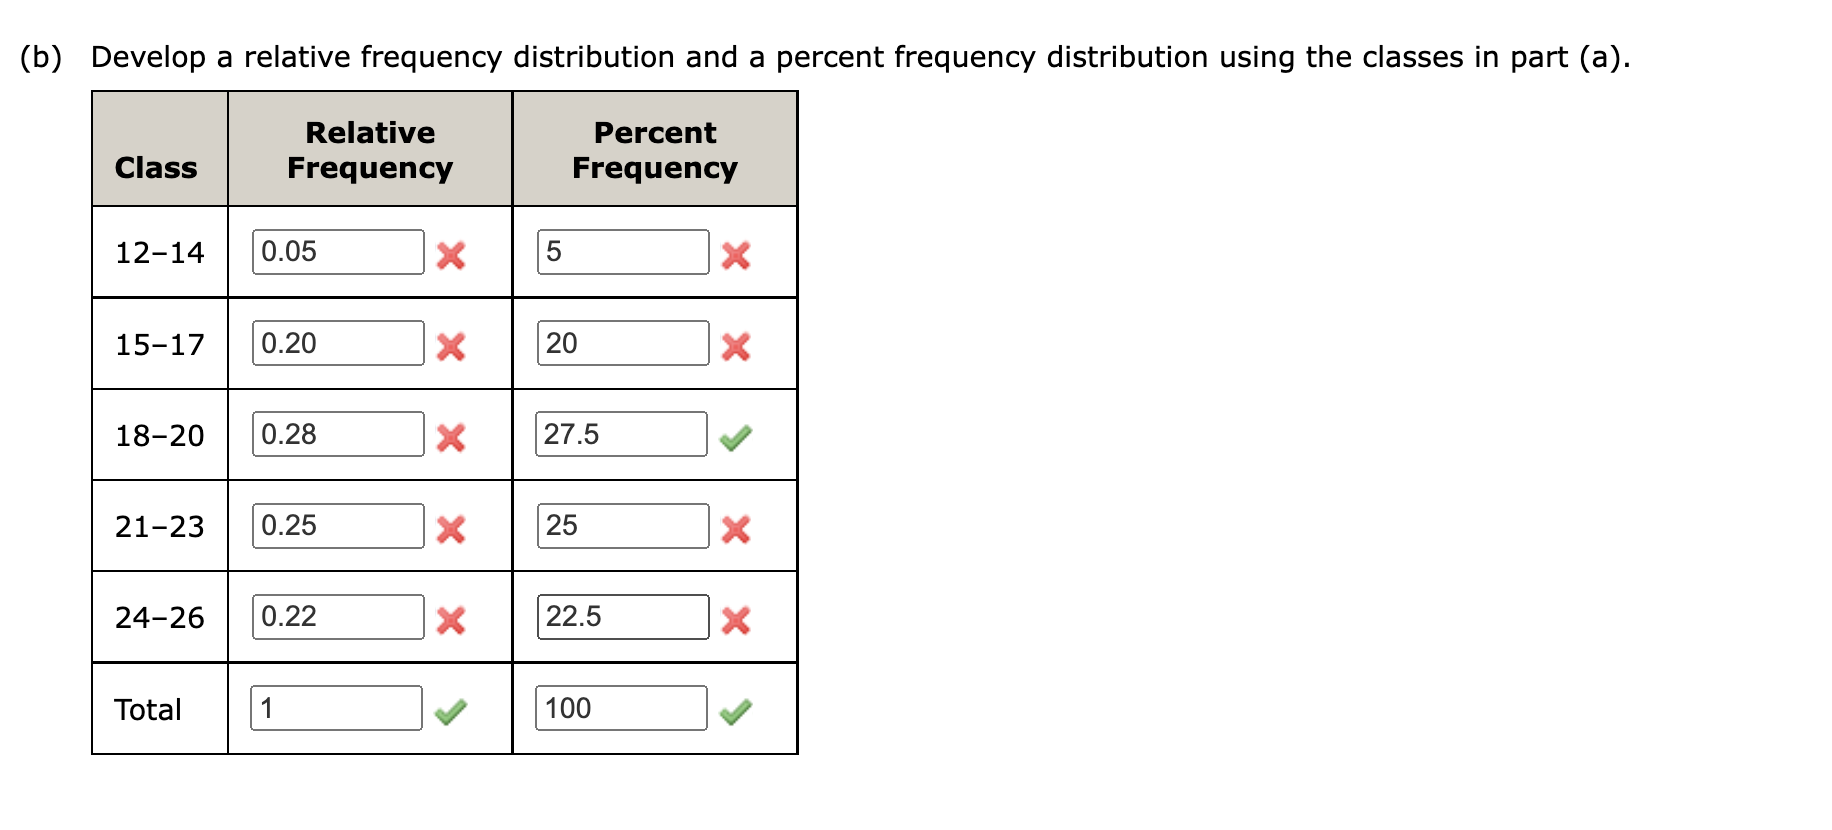
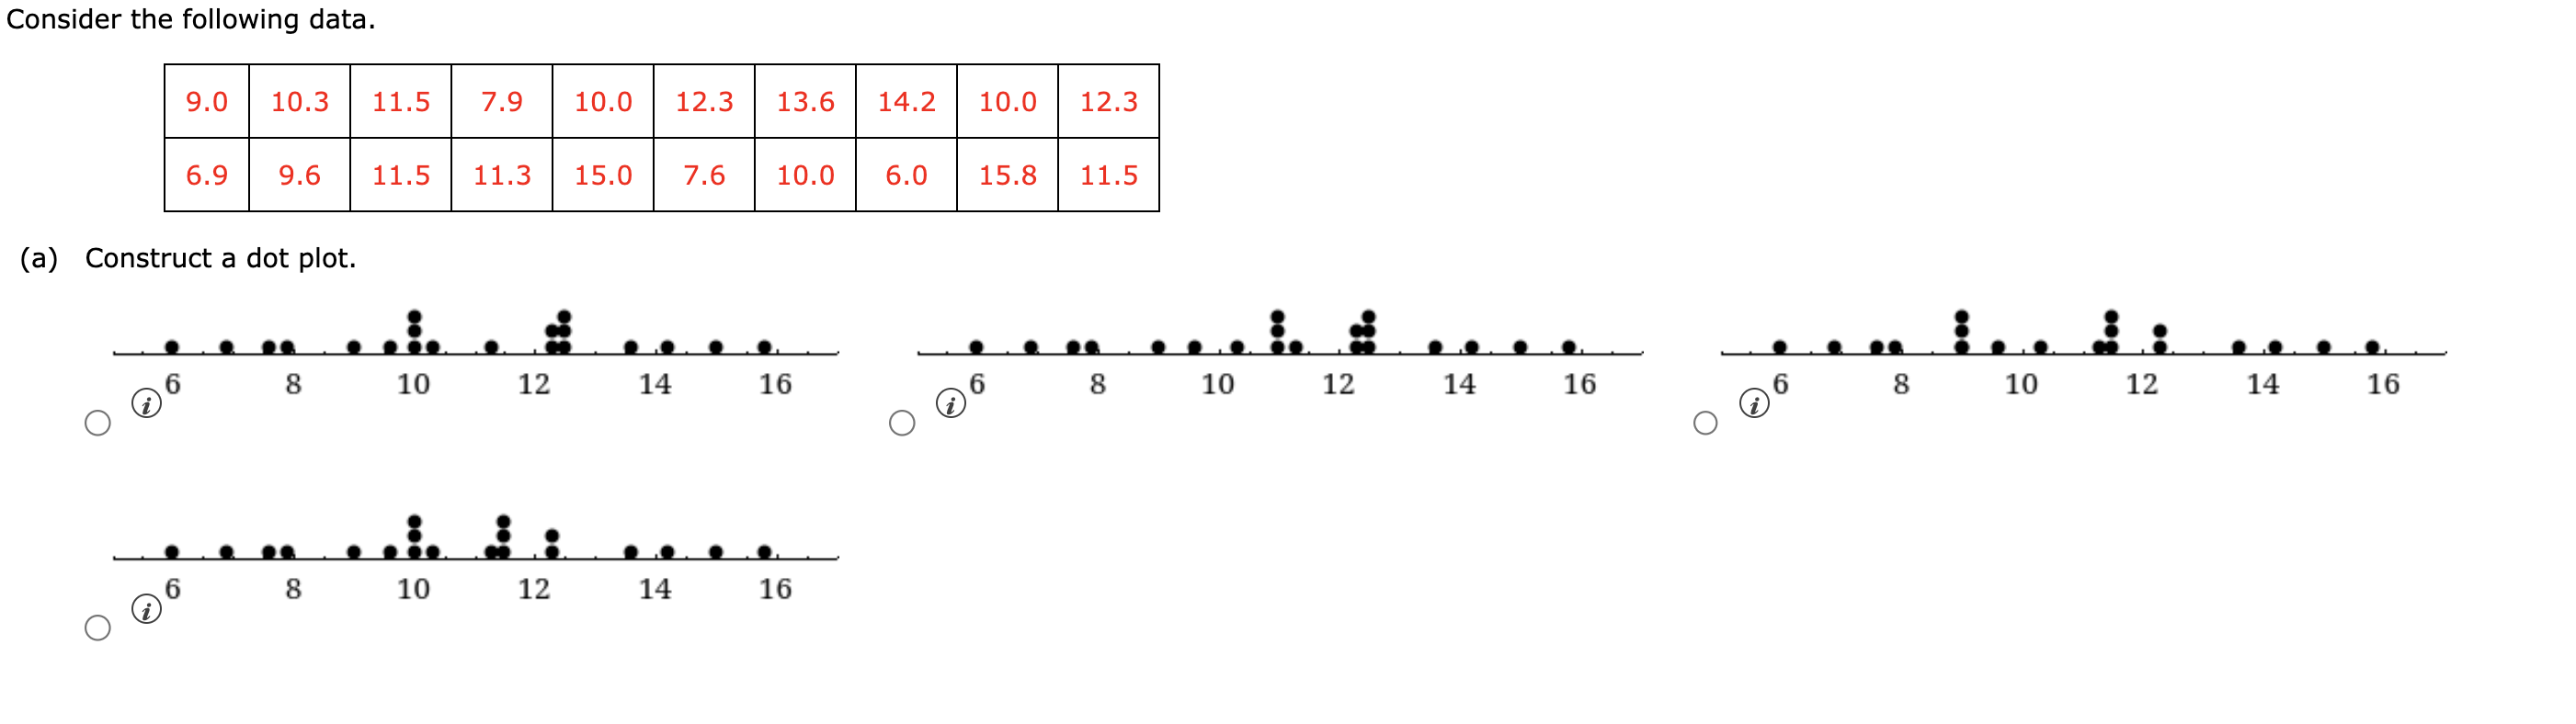
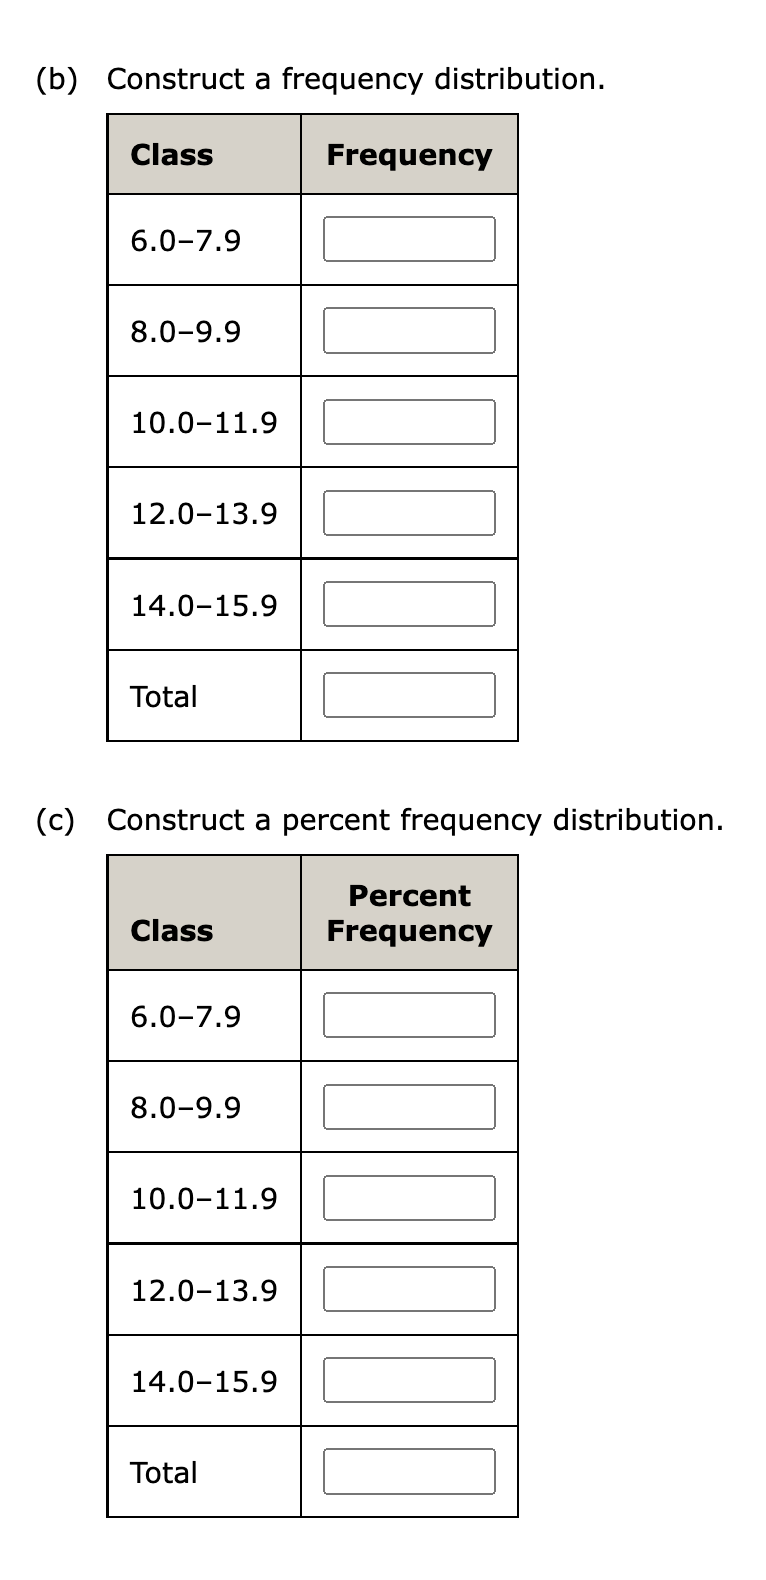
Question: Consider the following data. (b) Develop a relative frequency distribution and a percent frequency distribution using the classes in part (a). begin{tabular}{|l|l|l|} hline Class &

Consider the following data. (b) Develop aConsider the following data. (b) Develop aConsider the following data. (b) Develop aConsider the following data. (b) Develop aConsider the following data. (b) Develop aConsider the following data. (b) Develop a

Consider the following data. (b) Develop a relative frequency distribution and a percent frequency distribution using the classes in part (a). \begin{tabular}{|l|l|l|} \hline Class & Relative Frequency & Percent Frequency \\ \hline 1214 & 0.05 & 5 \\ \hline 1517 & 0.20 & \\ \hline 1820 & 0.28 & 20 \\ \hline 2123 & 0.25 & 27.5 \\ \hline 2426 & 0.22 & 25 \\ \hline Total & 1 & 22.5 \\ \hline \end{tabular} Consider the following frequency distribution. Consider the following frequency distribution. Construct a histogram for the data above. Consider the following data. (a) Construct a dot plot. (b) Construct a frequency distribution. (c) Construct a percent frequency distribution

Step by Step Solution

There are 3 Steps involved in it

1 Expert Approved Answer
Step: 1 Unlock blur-text-image
Question Has Been Solved by an Expert!

Get step-by-step solutions from verified subject matter experts

Step: 2 Unlock
Step: 3 Unlock

Students Have Also Explored These Related General Management Questions!