

Question: Consider the following data for the decomposition reaction: table [ [ Time ( s e c ) , Concentration of H 2 O 2
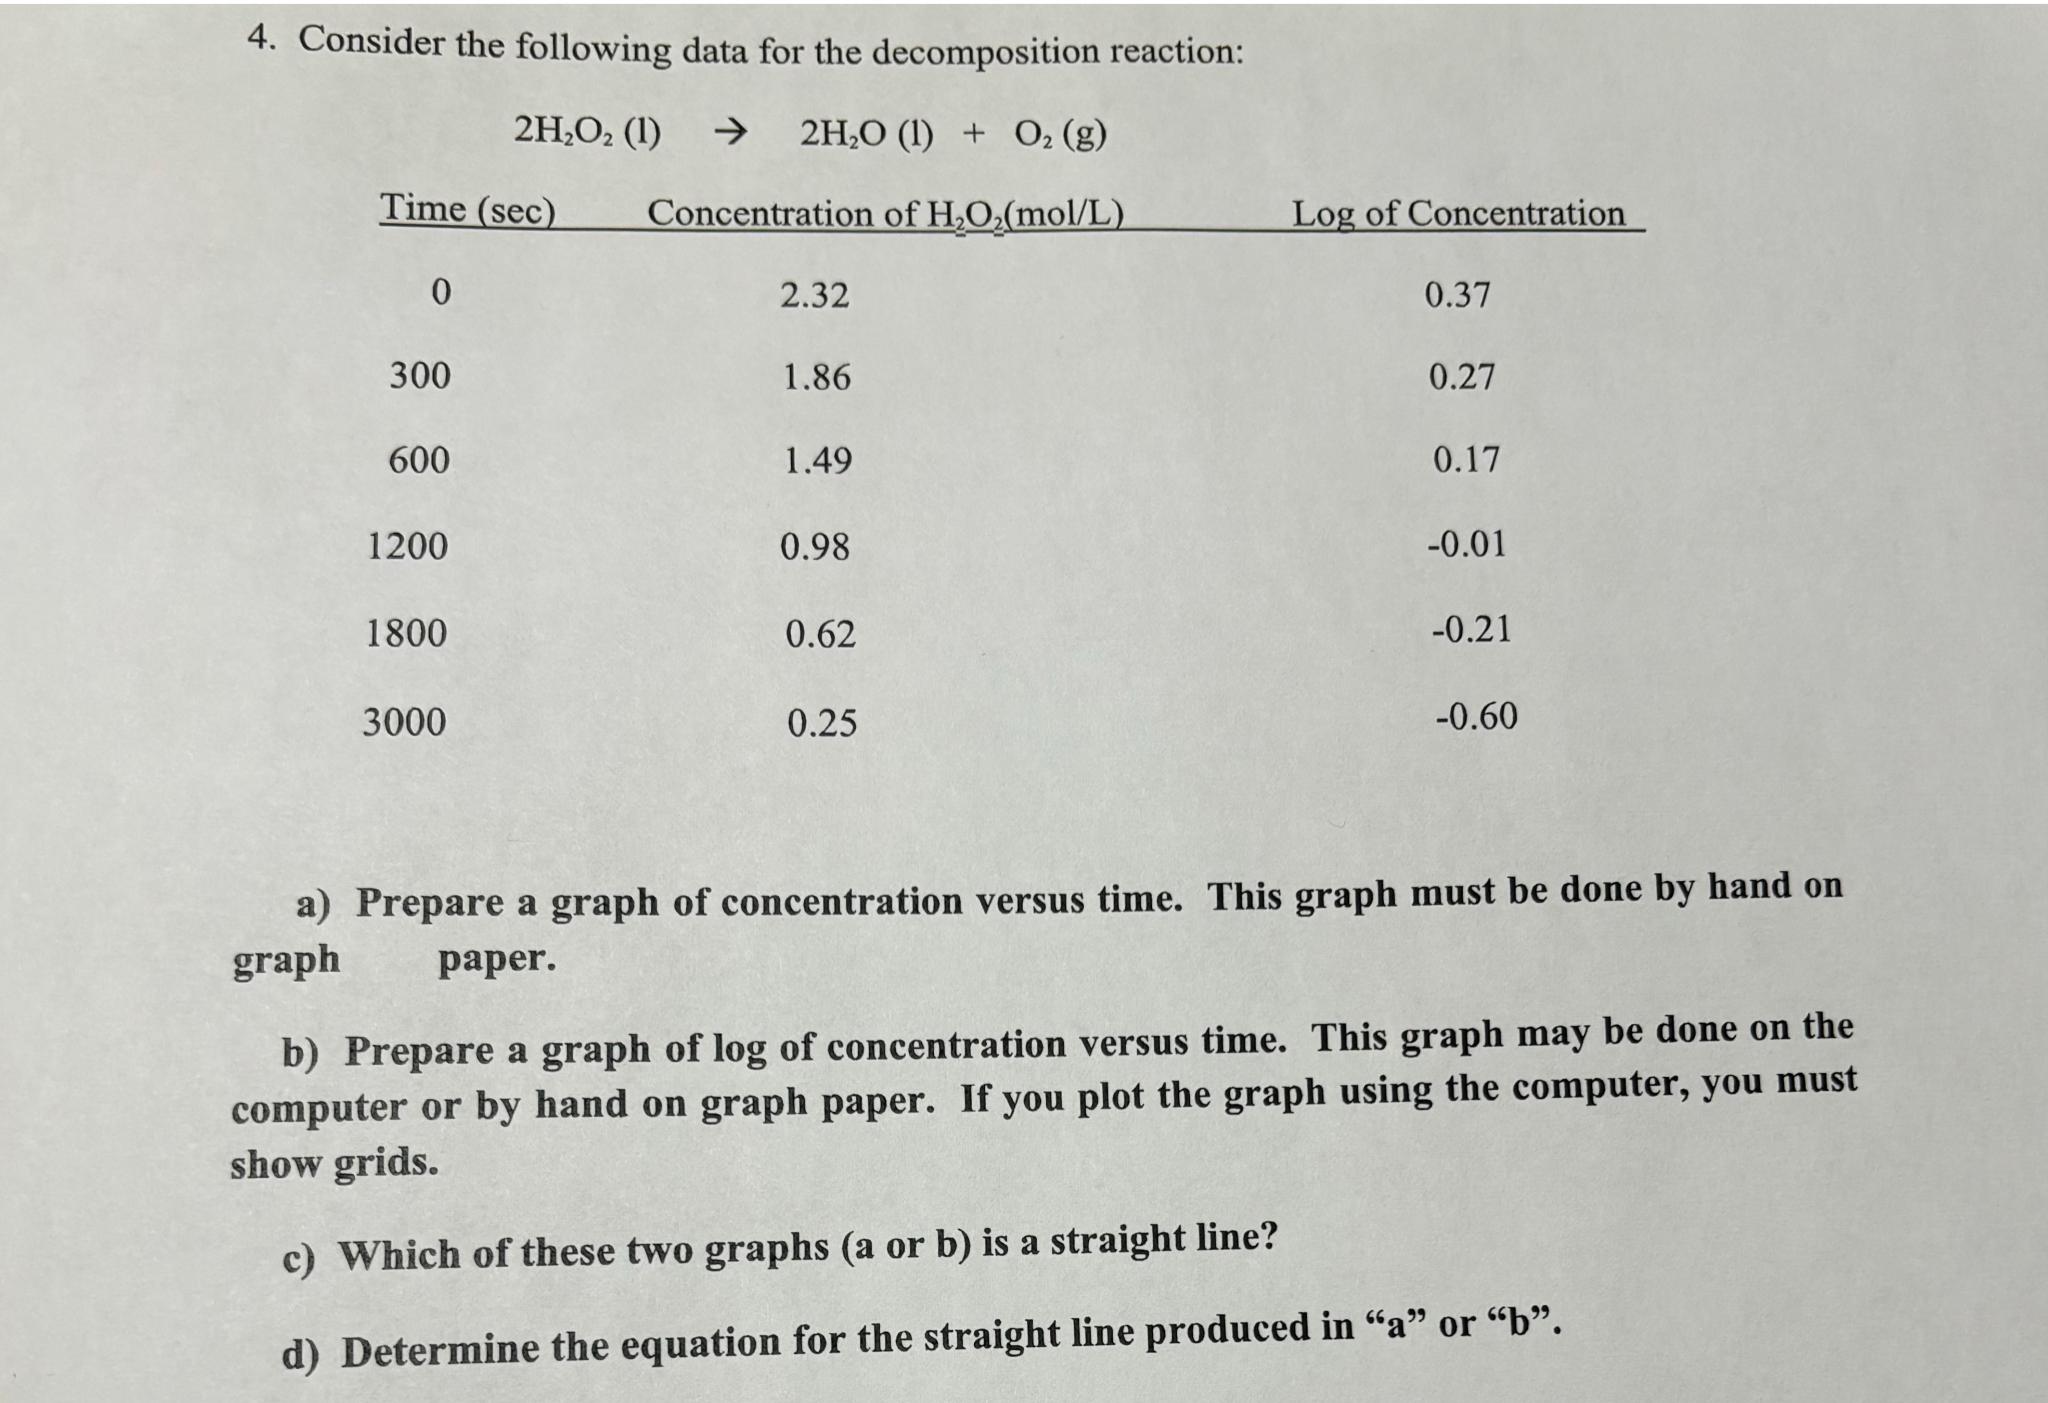
Consider the following data for the decomposition reaction:
tableTime Concentration of Log of Concentration
a Prepare a graph of concentration versus time. This graph must be done by hand on graph paper.
b Prepare a graph of of concentration versus time. This graph may be done on the computer or by hand on graph paper. If you plot the graph using the computer, you must show grids.
c Which of these two graphs a or b is a straight line?
d Determine the equation for the straight line produced in or
Step by Step Solution
There are 3 Steps involved in it
1 Expert Approved Answer
Step: 1 Unlock

Question Has Been Solved by an Expert!
Get step-by-step solutions from verified subject matter experts
Step: 2 Unlock
Step: 3 Unlock