

Question: Consider the following data on x = rainfall volume (m) and y = x 5 12 14 19 23 30 40 48 55 67
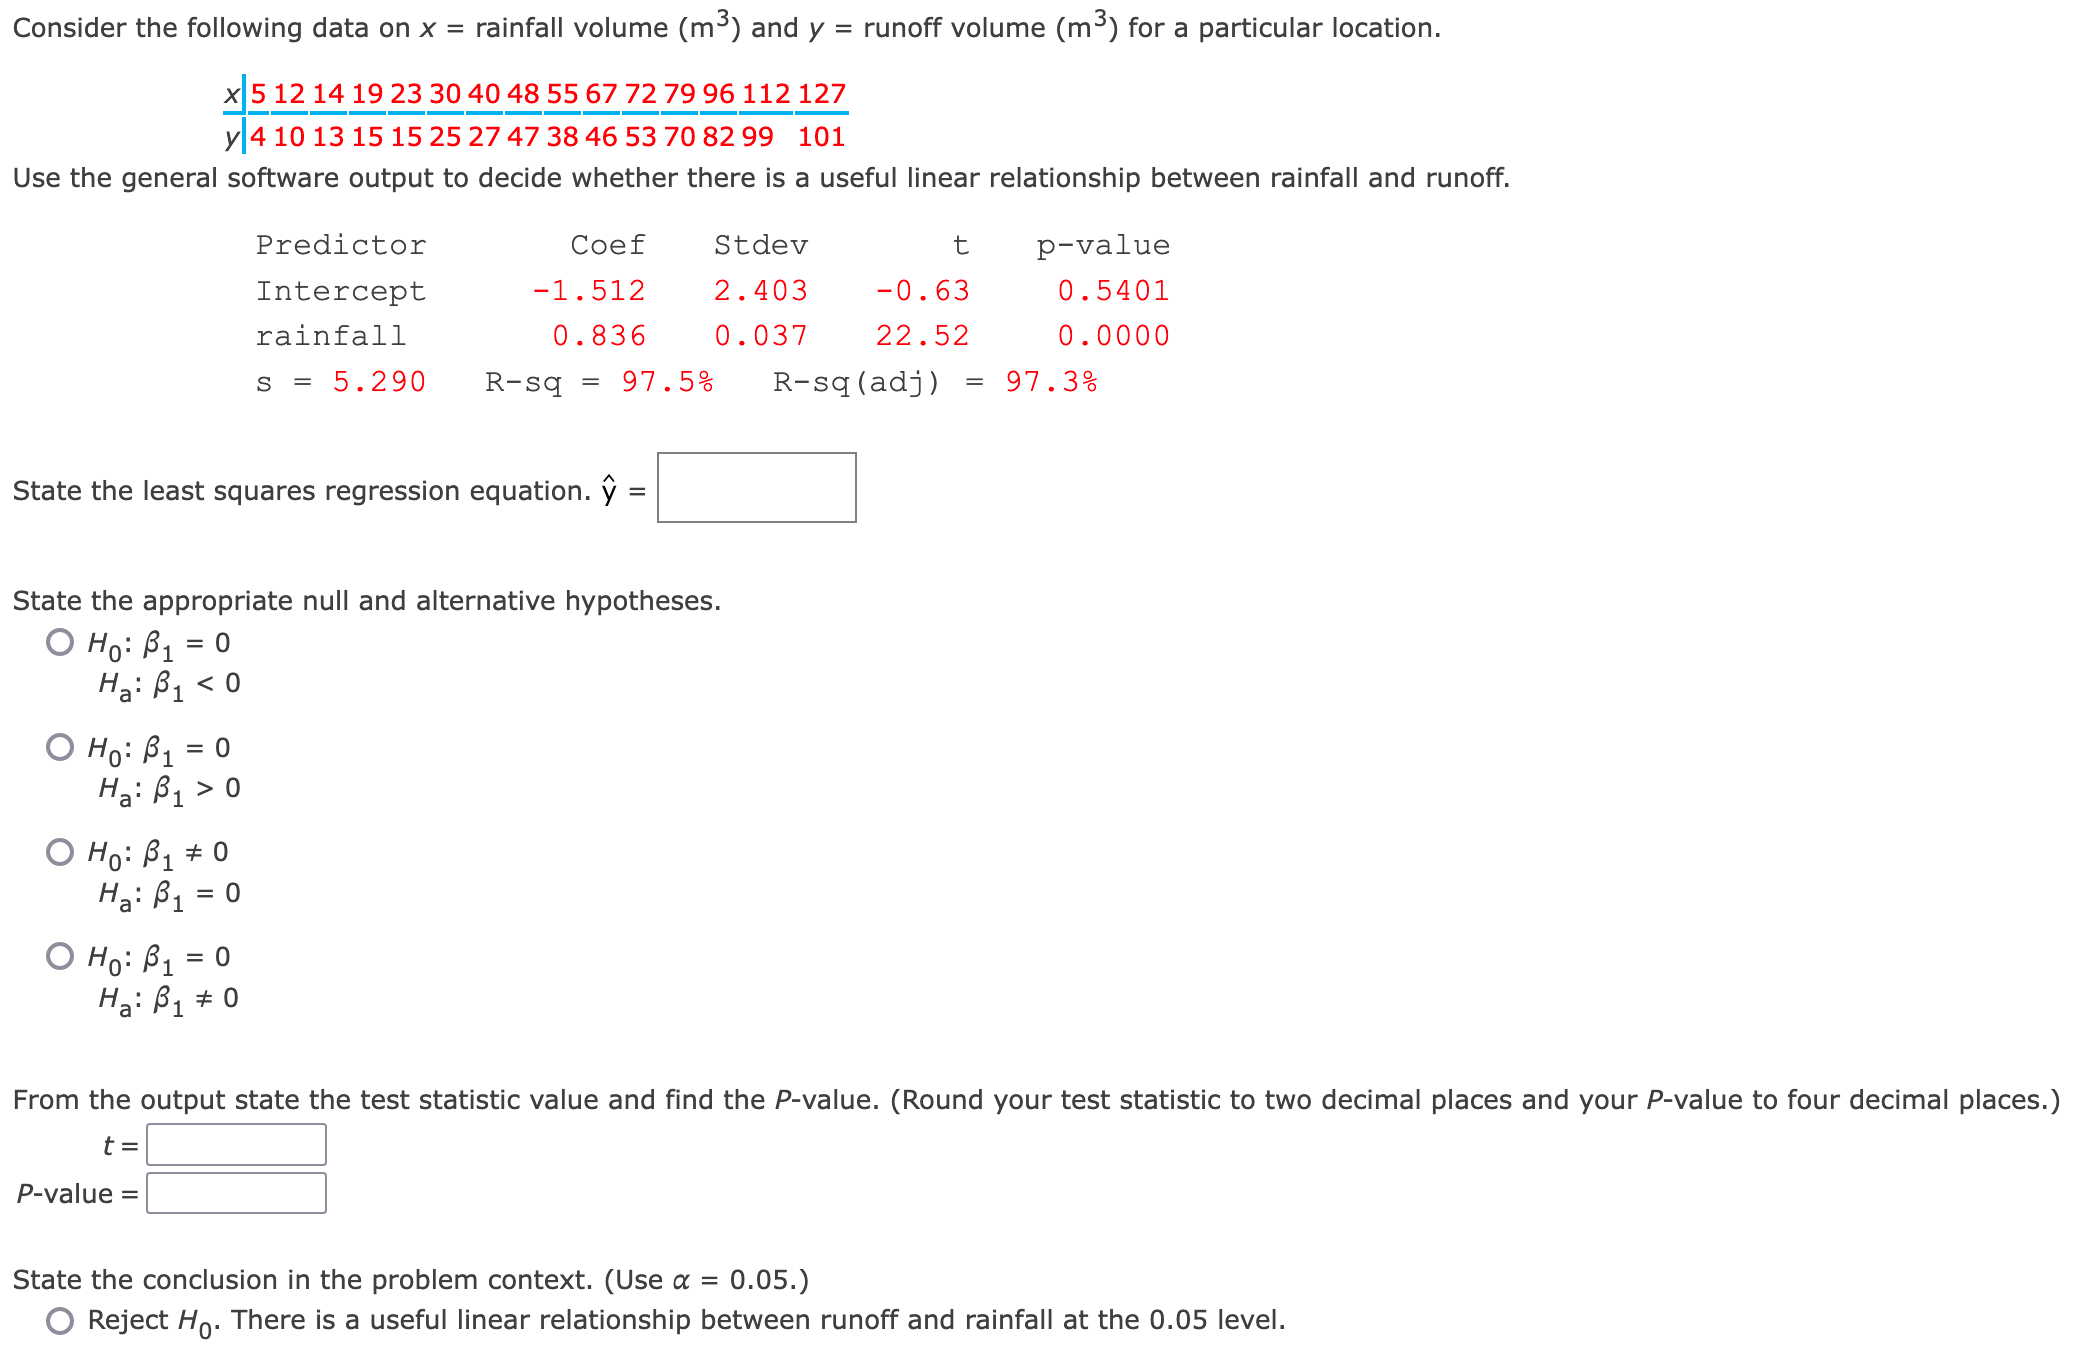
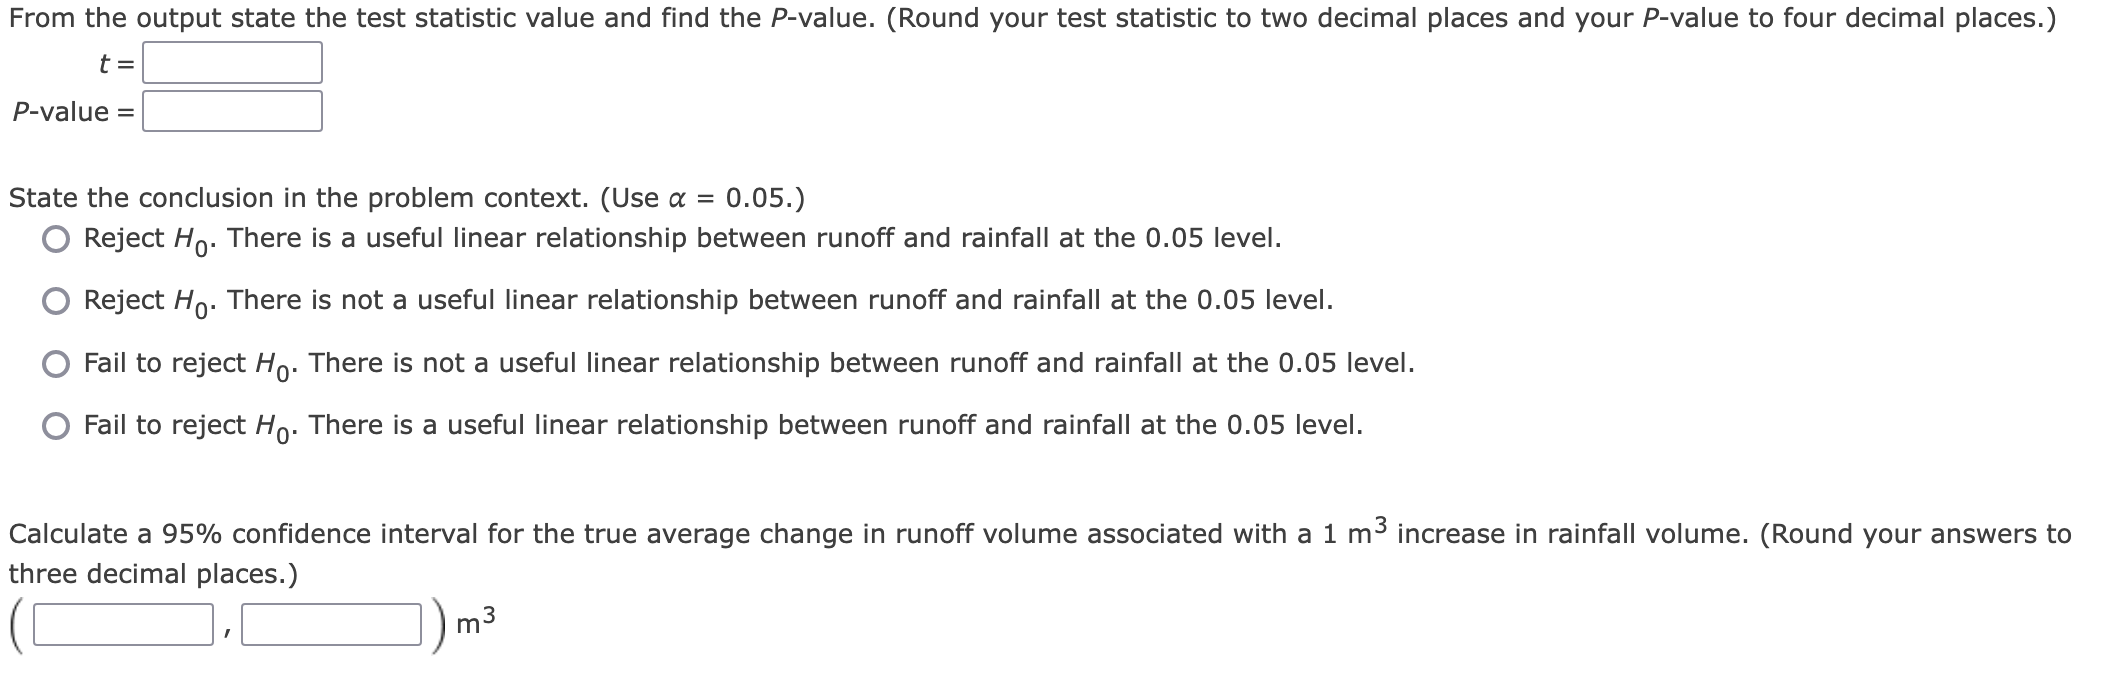
Consider the following data on x = rainfall volume (m) and y = x 5 12 14 19 23 30 40 48 55 67 72 79 96 112 127 y 4 10 13 15 15 25 27 47 38 46 53 70 82 99 101 runoff volume (m) for a particular location. Use the general software output to decide whether there is a useful linear relationship between rainfall and runoff. Predictor Intercept rainfall Coef -1.512 Stdev t p-value 2.403 -0.63 0.5401 0.836 0.037 22.52 0.0000 s = 5.290 R-sq = 97.5% R-sq (adj) = 97.3% State the least squares regression equation. = State the appropriate null and alternative hypotheses. = Ho: B1 0 Ha: B1 < 0 O Ho: B = 0 B1 Ha B10 O Ho: 1 0 Ha B = 0 B1 O Ho: P = 0 1 Ha B = 0 From the output state the test statistic value and find the P-value. (Round your test statistic to two decimal places and your P-value to four decimal places.) t = P-value = State the conclusion in the problem context. (Use = 0.05.) Reject Ho. There is a useful linear relationship between runoff and rainfall at the 0.05 level. From the output state the test statistic value and find the P-value. (Round your test statistic to two decimal places and your P-value to four decimal places.) t = P-value = State the conclusion in the problem context. (Use = 0.05.) Reject Ho. There is a useful linear relationship between runoff and rainfall at the 0.05 level. Reject Ho. There is not a useful linear relationship between runoff and rainfall at the 0.05 level. Fail to reject Ho. There is not a useful linear relationship between runoff and rainfall at the 0.05 level. Fail to reject Ho. There is a useful linear relationship between runoff and rainfall at the 0.05 level. Calculate a 95% confidence interval for the true average change in runoff volume associated with a 1 m increase in rainfall volume. (Round your answers to three decimal places.) m3
Step by Step Solution
There are 3 Steps involved in it

Get step-by-step solutions from verified subject matter experts