

Question: The picture below gives data on x = rainfall volume and y = runoff volume (both in m3). Test at level 0.05 whether there is
The picture below gives data on x = rainfall volume and y = runoff volume
(both in m3). Test at level 0.05 whether there is a useful linear relationship between
rainfall and runoff, and then calculate a 95% confidence interval for the true average
change in runoff volume associated with a 1 m3 increase in rainfall volume.
?
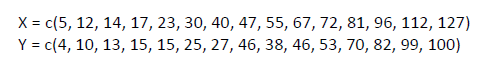
X = c(5, 12, 14, 17, 23, 30, 40, 47, 55, 67, 72, 81, 96, 112, 127) Y = c(4, 10, 13, 15, 15, 25, 27, 46, 38, 46, 53, 70, 82, 99, 100)
Step by Step Solution
There are 3 Steps involved in it
1 Expert Approved Answer
Step: 1 Unlock

Question Has Been Solved by an Expert!
Get step-by-step solutions from verified subject matter experts
Step: 2 Unlock
Step: 3 Unlock