

Question: Consider the following diagram: This diagram represents a parallel process which includes the N C x = 1 0 , a known bottleneck at the
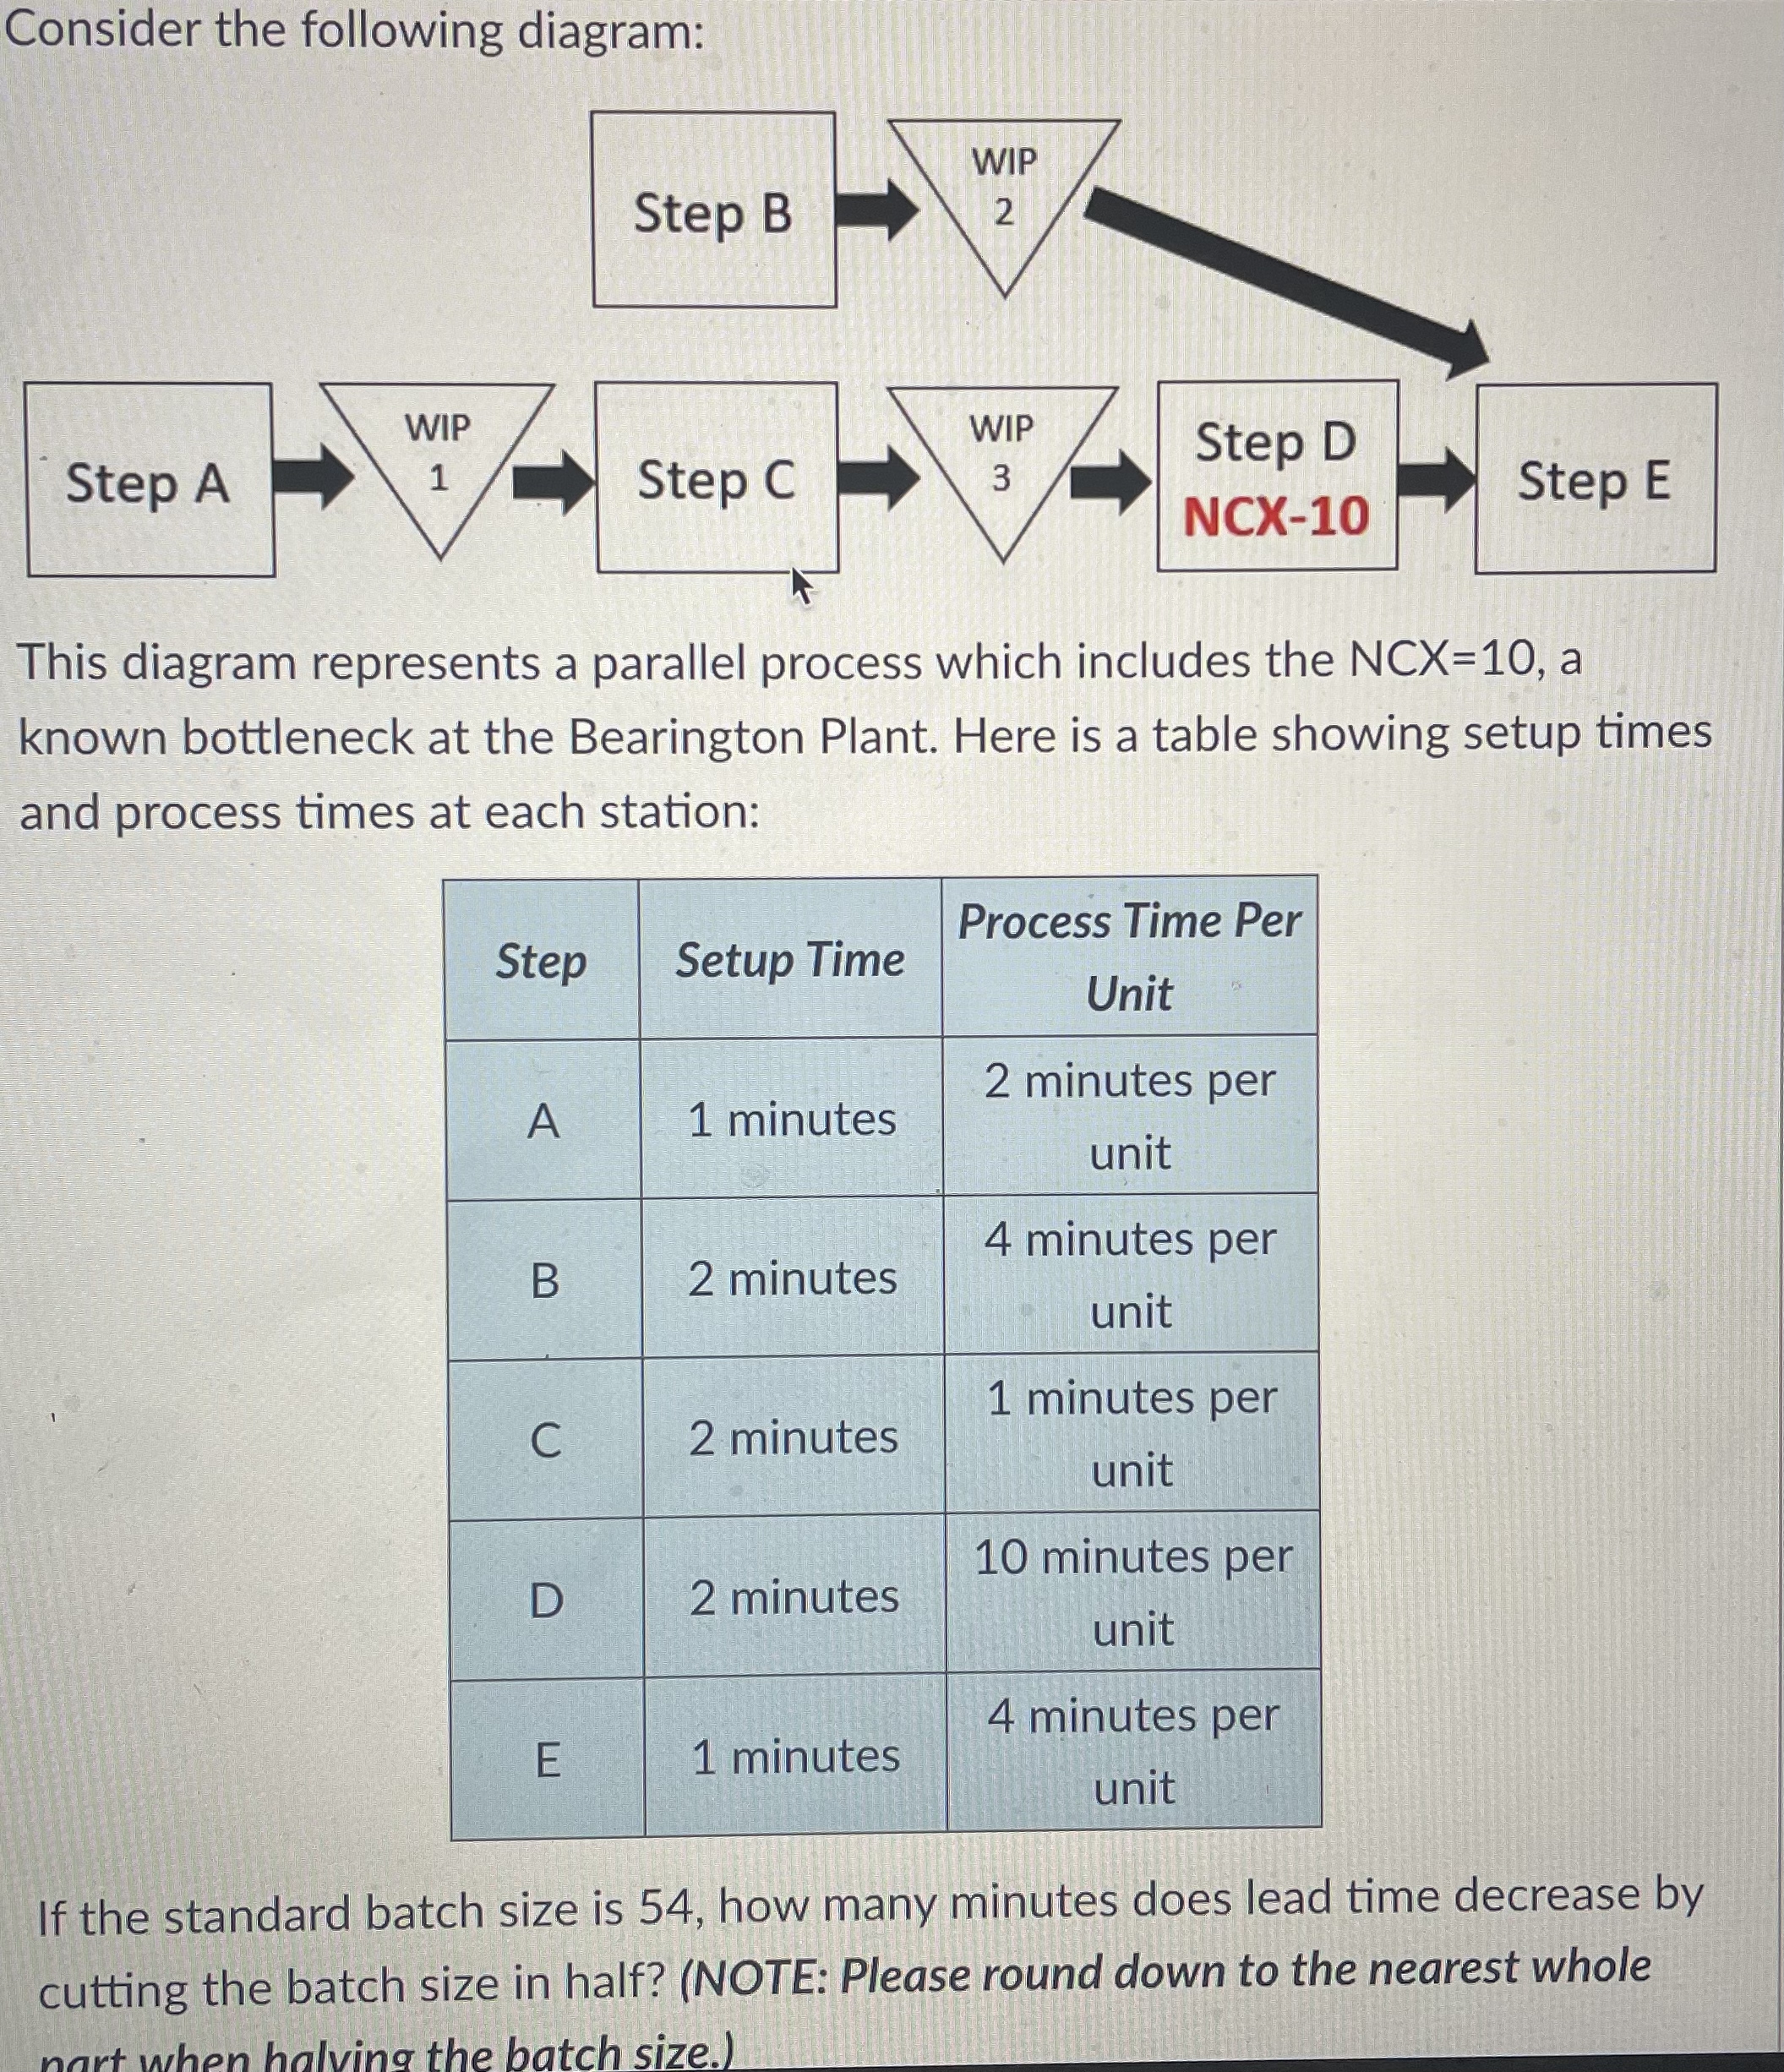
Consider the following diagram:
This diagram represents a parallel process which includes the a known bottleneck at the Bearington Plant. Here is a table showing setup times and process times at each station:
tableStepSetup Time,tableProcess Time PerUnitA minutes,table minutes perunitB minutes,table minutes perunitC minutes,table minutes perunitD minutes,table minutes perunitE minutes,table minutes perunit
If the standard batch size is how many minutes does lead time decrease by cutting the batch size in half? NOTE: Please round down to the nearest whole
Step by Step Solution
There are 3 Steps involved in it
1 Expert Approved Answer
Step: 1 Unlock

Question Has Been Solved by an Expert!
Get step-by-step solutions from verified subject matter experts
Step: 2 Unlock
Step: 3 Unlock