

Question: Consider the following graph on the interval -150 < x < 255: 150-120 -90 -60 -30 5 4 3 2 1 -1 -2 30
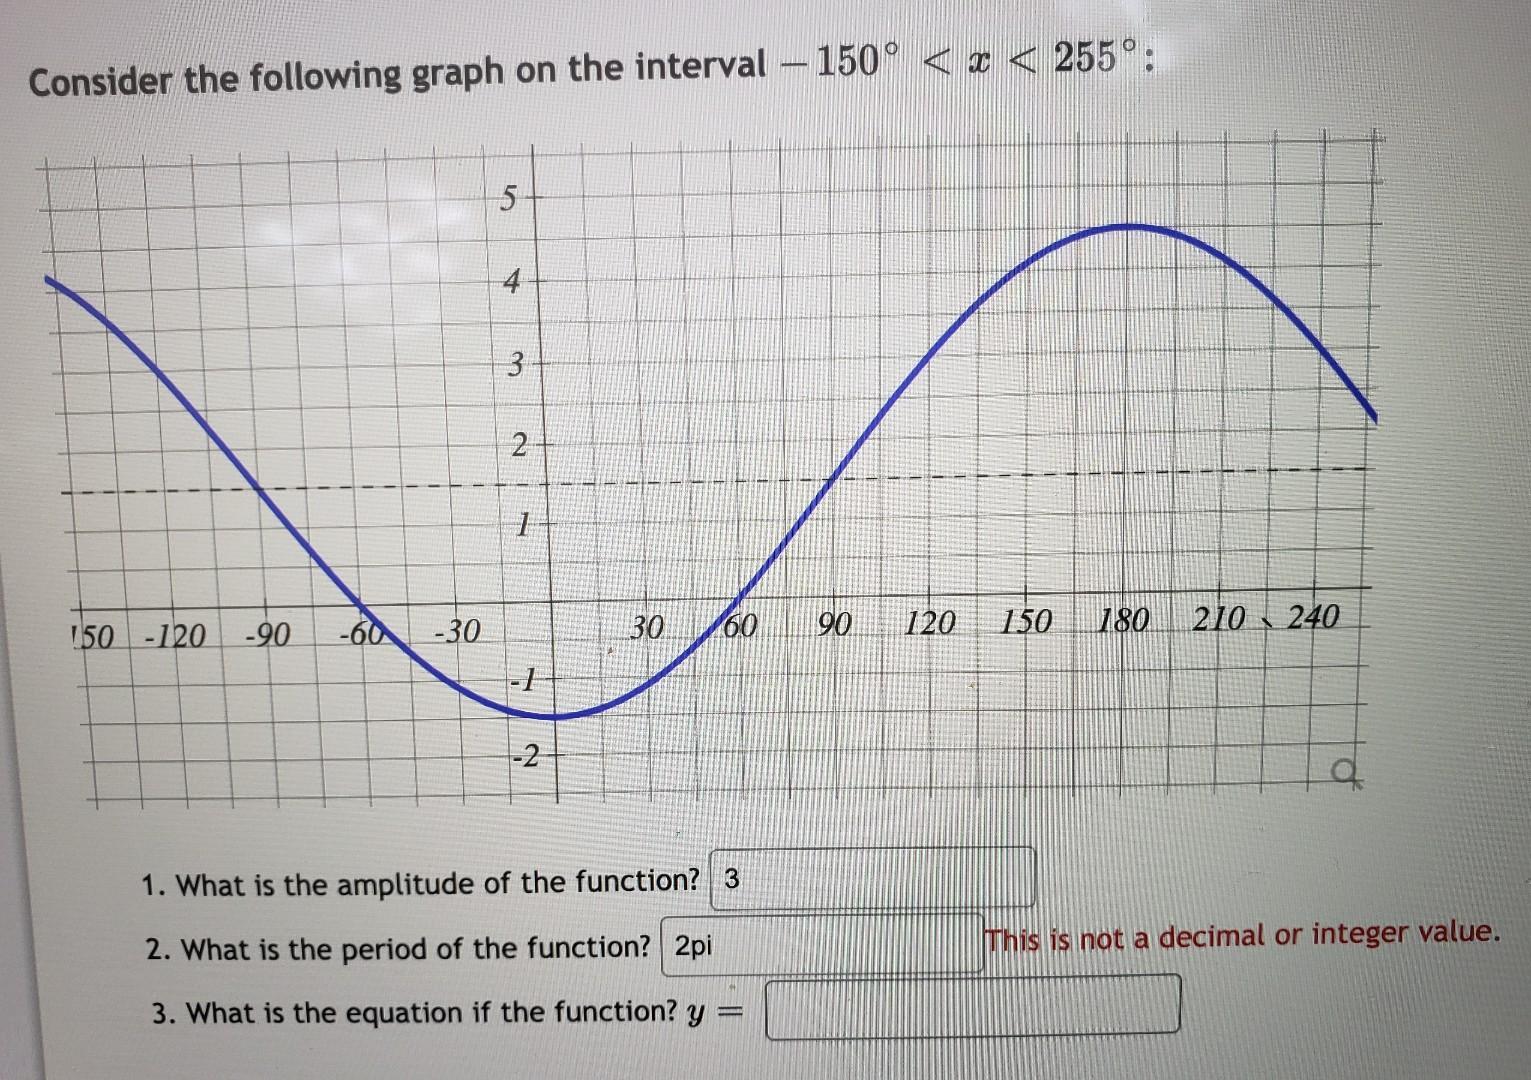
Consider the following graph on the interval -150 < x < 255: 150-120 -90 -60 -30 5 4 3 2 1 -1 -2 30 60 1. What is the amplitude of the function? 3 2. What is the period of the function? 2pi 3. What is the equation if the function? y 90 120 150 180 210 240 a This is not a decimal or integer value.
Step by Step Solution
★★★★★
3.43 Rating (162 Votes )
There are 3 Steps involved in it
1 Expert Approved Answer
Step: 1 Unlock

SOLUTION A Amplitude is given by maximum yordinate measured ... View full answer
Question Has Been Solved by an Expert!
Get step-by-step solutions from verified subject matter experts
Step: 2 Unlock
Step: 3 Unlock