

Question: Consider the following graph on the interval -300 < x < 90: -270-240 -210 -180 -150 -120 -90 1. What is the amplitude of
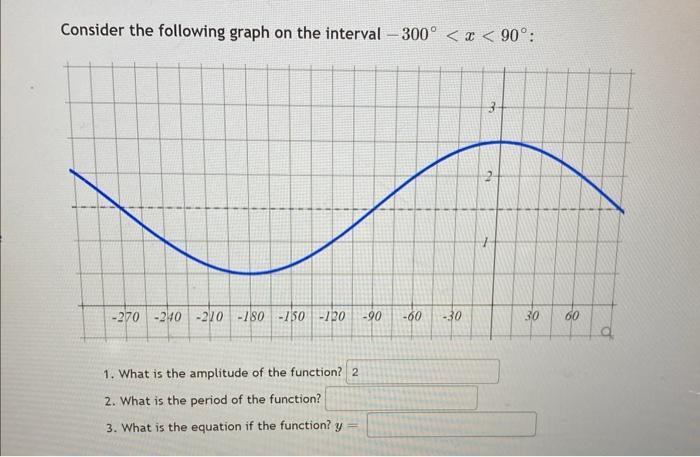
Consider the following graph on the interval -300 < x < 90: -270-240 -210 -180 -150 -120 -90 1. What is the amplitude of the function? 2 2. What is the period of the function? 3. What is the equation if the function? y = -60 -30 o 30 60 q
Step by Step Solution
★★★★★
3.37 Rating (156 Votes )
There are 3 Steps involved in it
1 Expert Approved Answer
Step: 1 Unlock

1 Amplitude is the maximum yvalue which a function attains on its graph ... View full answer
Question Has Been Solved by an Expert!
Get step-by-step solutions from verified subject matter experts
Step: 2 Unlock
Step: 3 Unlock