

Question: Consider the following histogram: Frequency 12 10 8 19 2 3 6 9 12 15 18 21 24 Data Value Which frequency table best
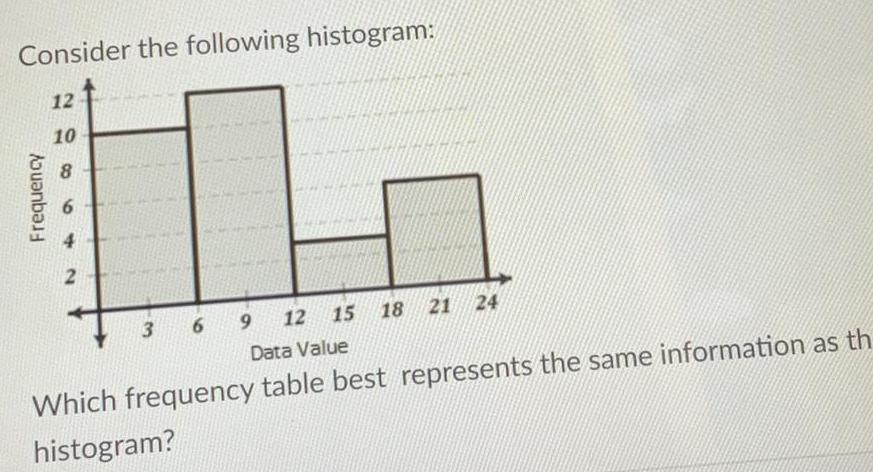
Consider the following histogram: Frequency 12 10 8 19 2 3 6 9 12 15 18 21 24 Data Value Which frequency table best represents the same information as th histogram?
Step by Step Solution
There are 3 Steps involved in it
1 Expert Approved Answer
Step: 1 Unlock

Question Has Been Solved by an Expert!
Get step-by-step solutions from verified subject matter experts
Step: 2 Unlock
Step: 3 Unlock