Question: Consider the following linear program. Min 8X + 12Y S.C. 1X + 3Y 27 2x + 2y = 10 6x + 2y 2 14 X,
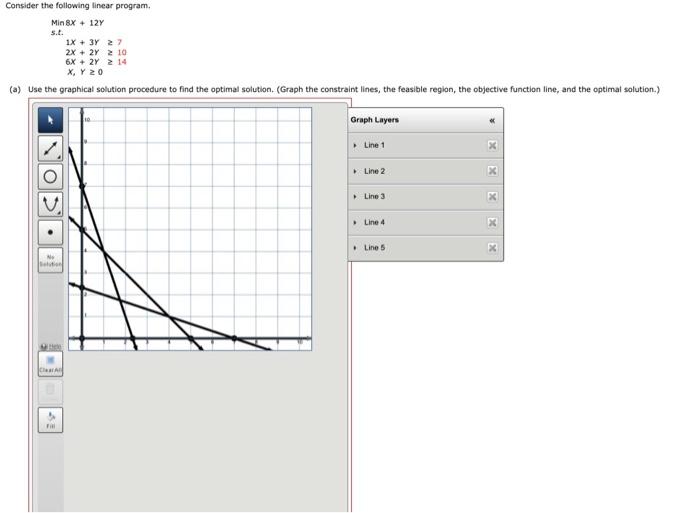
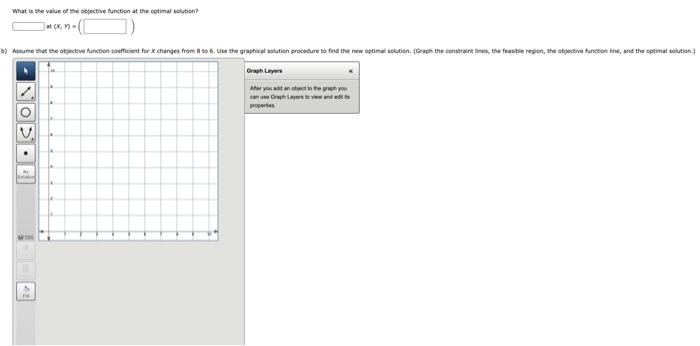
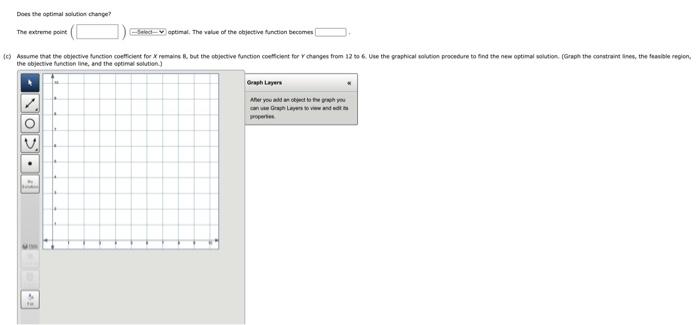
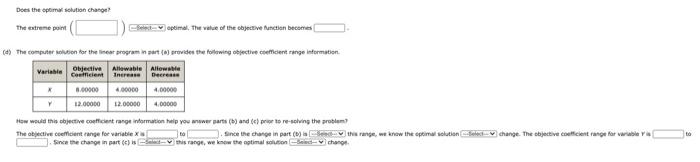
Consider the following linear program. Min 8X + 12Y S.C. 1X + 3Y 27 2x + 2y = 10 6x + 2y 2 14 X, Y 20 (a) Use the graphical solution procedure to find the optimal solution (Graph the constraint lines, the feasible region, the objective function line, and the optimal solution.) Graph Layers Line 1 Line 2 X Line 3 X Line 4 X Line 5 X What is the value of the objective tunction at the optimal solution? at , > Asume that the objective function coefficient for changes from s 6. the graphical solution procedure to feed the new optimal solution. (Geson the constraint tine, the feasibile region, the objective function in, and the otimal solution) Graph Layers Ahor you at an object to the preyou Graphenende propres ::SON Does the optimal solution change? The extreme point See optimal. The le of the objective function becomes c) Assume that the tive unction coefficient for remains ll, but the objective function coefficient for changes from 12 6. Use the graphical solution procedure to find the new optimal solution (Graph the constraints, the feasible region, the objective function line, and the optimal ston) Graph Layer Aller youth Grahova VO. Does the optimal solution change? The extreme point of the objective to become (4) The computer solution for the linear program in provides the following objective coeficient range information Variable Cocin intrean Deere Objective Allowable Allowane 400000 400000 Y 12.00000 12.00000 4.00000 How would this objective conflict range information help you wer parts () and cto resolving the problem The objective coefficient mange for variable to Since the change in part() Change wow the optimal solution change. The objective efficient anar al Since the change in parti this range, we know the optimal solution Bedevchange Consider the following linear program. Min 8X + 12Y S.C. 1X + 3Y 27 2x + 2y = 10 6x + 2y 2 14 X, Y 20 (a) Use the graphical solution procedure to find the optimal solution (Graph the constraint lines, the feasible region, the objective function line, and the optimal solution.) Graph Layers Line 1 Line 2 X Line 3 X Line 4 X Line 5 X What is the value of the objective tunction at the optimal solution? at , > Asume that the objective function coefficient for changes from s 6. the graphical solution procedure to feed the new optimal solution. (Geson the constraint tine, the feasibile region, the objective function in, and the otimal solution) Graph Layers Ahor you at an object to the preyou Graphenende propres ::SON Does the optimal solution change? The extreme point See optimal. The le of the objective function becomes c) Assume that the tive unction coefficient for remains ll, but the objective function coefficient for changes from 12 6. Use the graphical solution procedure to find the new optimal solution (Graph the constraints, the feasible region, the objective function line, and the optimal ston) Graph Layer Aller youth Grahova VO. Does the optimal solution change? The extreme point of the objective to become (4) The computer solution for the linear program in provides the following objective coeficient range information Variable Cocin intrean Deere Objective Allowable Allowane 400000 400000 Y 12.00000 12.00000 4.00000 How would this objective conflict range information help you wer parts () and cto resolving the problem The objective coefficient mange for variable to Since the change in part() Change wow the optimal solution change. The objective efficient anar al Since the change in parti this range, we know the optimal solution Bedevchange