

Question: Consider the following mini case and answer the prompt below. Over the past 6 months, ECU Pirate Health has undertaken numerous marketing and population health
Consider the following mini case and answer the prompt below. Over the past 6 months, ECU Pirate Health has undertaken numerous marketing and population health projects and initiatives to attract new patients. As part of this initiative, the manager has decided that it would be helpful for new patients to understand the breadth of services provided by ECU Pirate Health and provide a tangible acknowledgement of their appreciation for choosing ECU Pirate Health. Therefore, the ECU Pirate Health Patient Services department has developed a process to make a bag/packet for each new primary care patient in the system. The process includes the following steps: Station 1: Look up the new patient in the electronic health record and generate a name label. Station 2: Grab ECU Pirate Health gift bag and insert folder Station 3: Take folder out and add in general information about ECU Pirate Health Station 4: Look up patient's age/sex and then processed to shelf to grab the correct healthcare wellness items, add item(s) to gift bag. Station 5: Add bow to top of bag and visually inspect to ensure all items are included. Five employees in the Patient Services department met to create their first set of gift bags as an experiment. They collected processing data for the first 20 gift bags and the data is included BELOW. Throughput data was also collected on every 5th bag. Quality data was also collected. The team noticed that their process was not very efficient and many on the team spent too much time waiting. Consider the following prompt: Using concepts learned in this course about Six Sigma, apply the six-sigma analysis on the current process and make at least two recommendation for improvement.
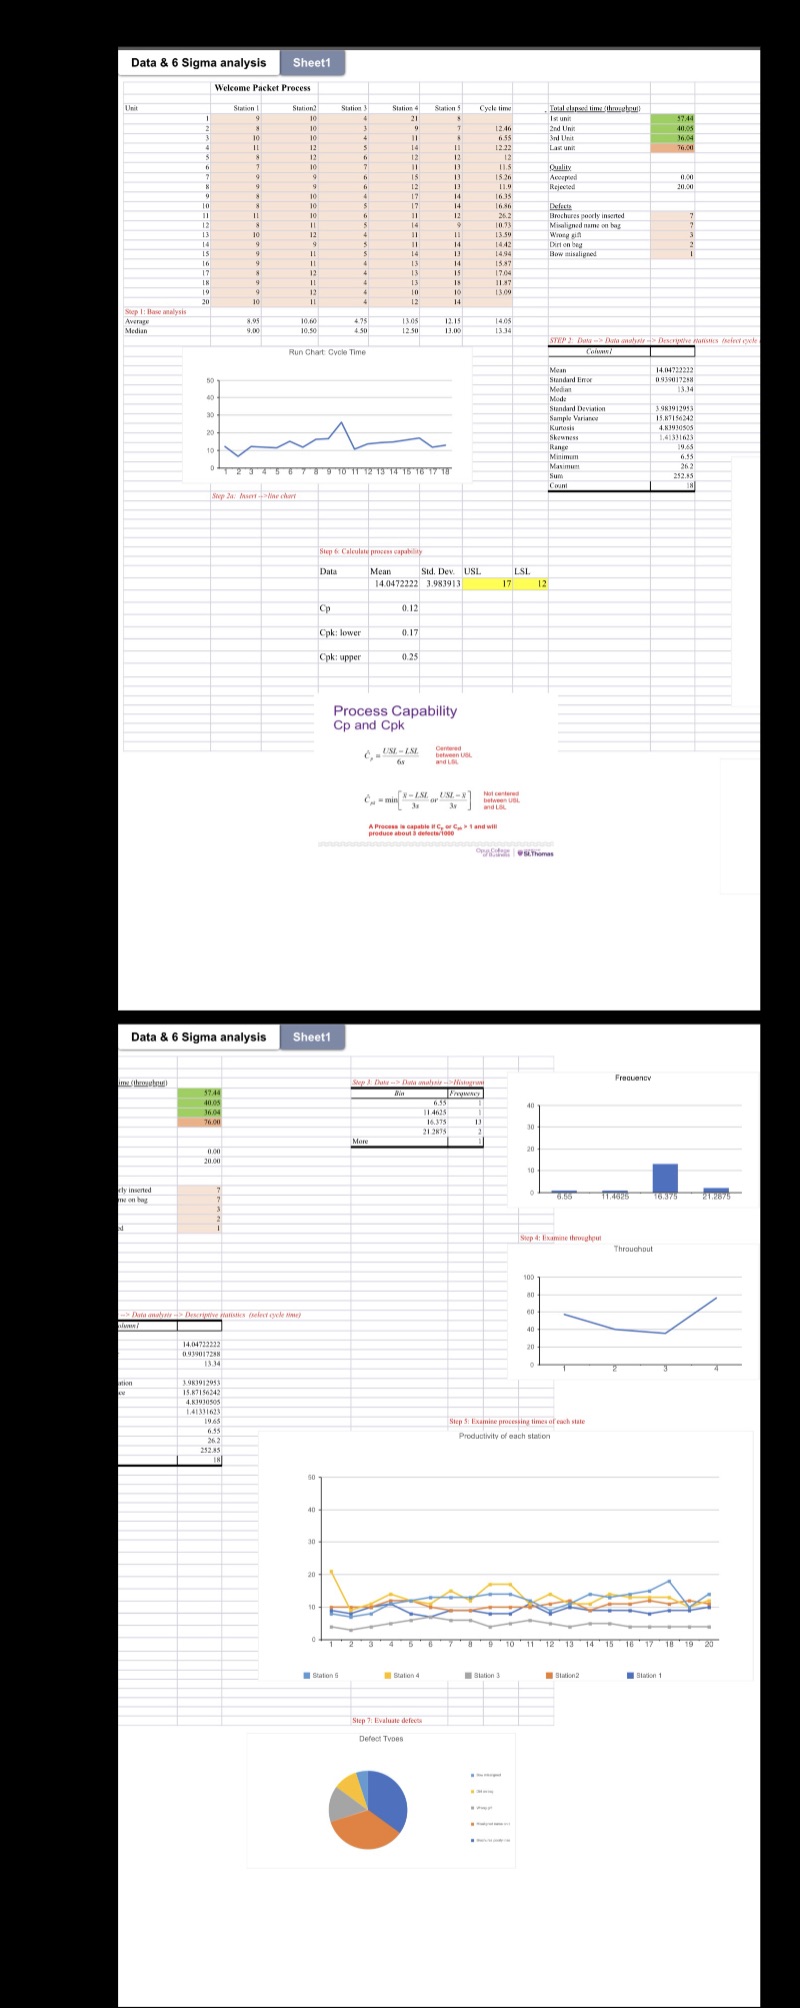
Data & 6 Sigma analysis Sheet1 Welcome Packet Process Station ! Station Station Station Station S Cycle time Total elapsed time (threeton) 12 46 end Un Laz uni Quality 1526 0.60 Rejected 20.80 1635 1636 262 Defects Brochures poorly inserted 13 59 Wrong gin 14 42 Dirt on bed Bow misaligned 17 84 Shep 1 : Hase analysis Average 4.75 1305 12.15 1405 Median 4.09 10.50 12 50 13 34 re Manisties feeint cycle Run Chart Cycle Time 0939017258 13.34 Made Standard Deviation 3 983912953 Sample Variaray Kunosis 4.83930505 Skewness 1.41531623 Range 19.45 Minimum 2 1 4 5 6 7 8 9 10 1 12 13 14 15 16 17 18 252.55 Step & Calculate process capable Data Mean Sid. Dev. USL LSL. 14.0472222 3.983913 17 12 Cp 0.12 Cpk: lower 0.17 Cpk: upper 0.25 Process Capability Cp and Cpk C, . USE. - LSI. Co - min -181 , US. -8 A Process to arp Data & 6 Sigma analysis Sheet1 Frequency 14:375 More he on bag 11.4625 16:375 Shop 4: lixamine throughout Throughout 100 Data analysis -E. Descriptive Matisties (select cicle Ames 14.04722212 1 939017258 13.34 2983912953 15.87156242 4.83930505 19.65 Step 5: Exanice processing times of each state 635 26 2 Productivity of each station 292.85 2 3 4 5 6 7 8 9 10 11 12 13 14 15 18 17 18 19 20 Station Station 4 Station 3 Station2 Station 1 Step 7: Evaluate defects Defect Tunes
Step by Step Solution
There are 3 Steps involved in it

Get step-by-step solutions from verified subject matter experts