

Question: Consider the following table for different assets for 1926 through 2017. Series Average return Standard Deviation Large-company stocks 12.1% 19.8% Small-company stocks 16.5 317
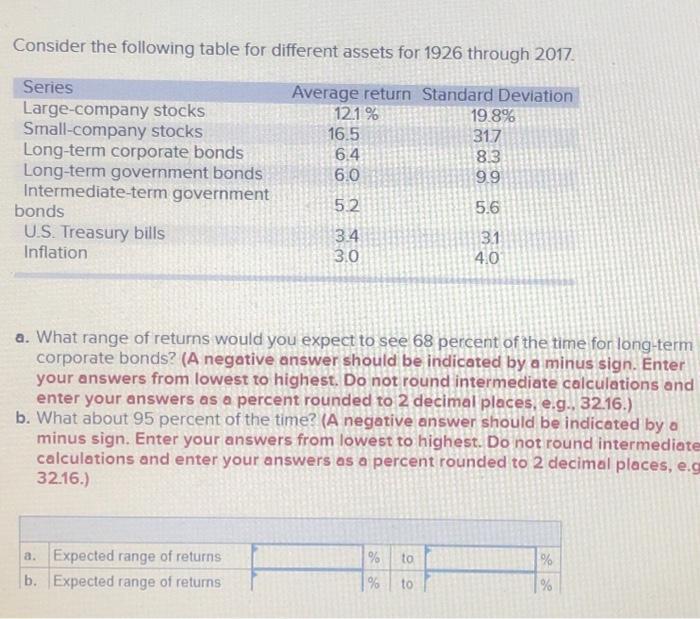
Consider the following table for different assets for 1926 through 2017. Series Average return Standard Deviation Large-company stocks 12.1% 19.8% Small-company stocks 16.5 317 Long-term corporate bonds 6.4 8.3 Long-term government bonds 6.0 99 Intermediate-term government 5.2 bonds 5.6 U.S. Treasury bills Inflation 33 3.4 3.1 3.0 4.0 a. What range of returns would you expect to see 68 percent of the time for long-term corporate bonds? (A negative answer should be indicated by a minus sign. Enter your answers from lowest to highest. Do not round intermediate calculations and enter your answers as a percent rounded to 2 decimal places, e.g., 32.16.) b. What about 95 percent of the time? (A negative answer should be indicated by a minus sign. Enter your answers from lowest to highest. Do not round intermediate calculations and enter your answers as a percent rounded to 2 decimal places, e.g 32.16.) a. Expected range of returns b. Expected range of returns ge ge % to % % to %
Step by Step Solution
There are 3 Steps involved in it
a To calculate the range of returns that would be expected to see 68 percent of the time for longter... View full answer

Get step-by-step solutions from verified subject matter experts