

Question: Consider the following time series data. Week 1 2 2 4 5 61 Value 19 12 16 12 18 13 (a) Construct a time beries
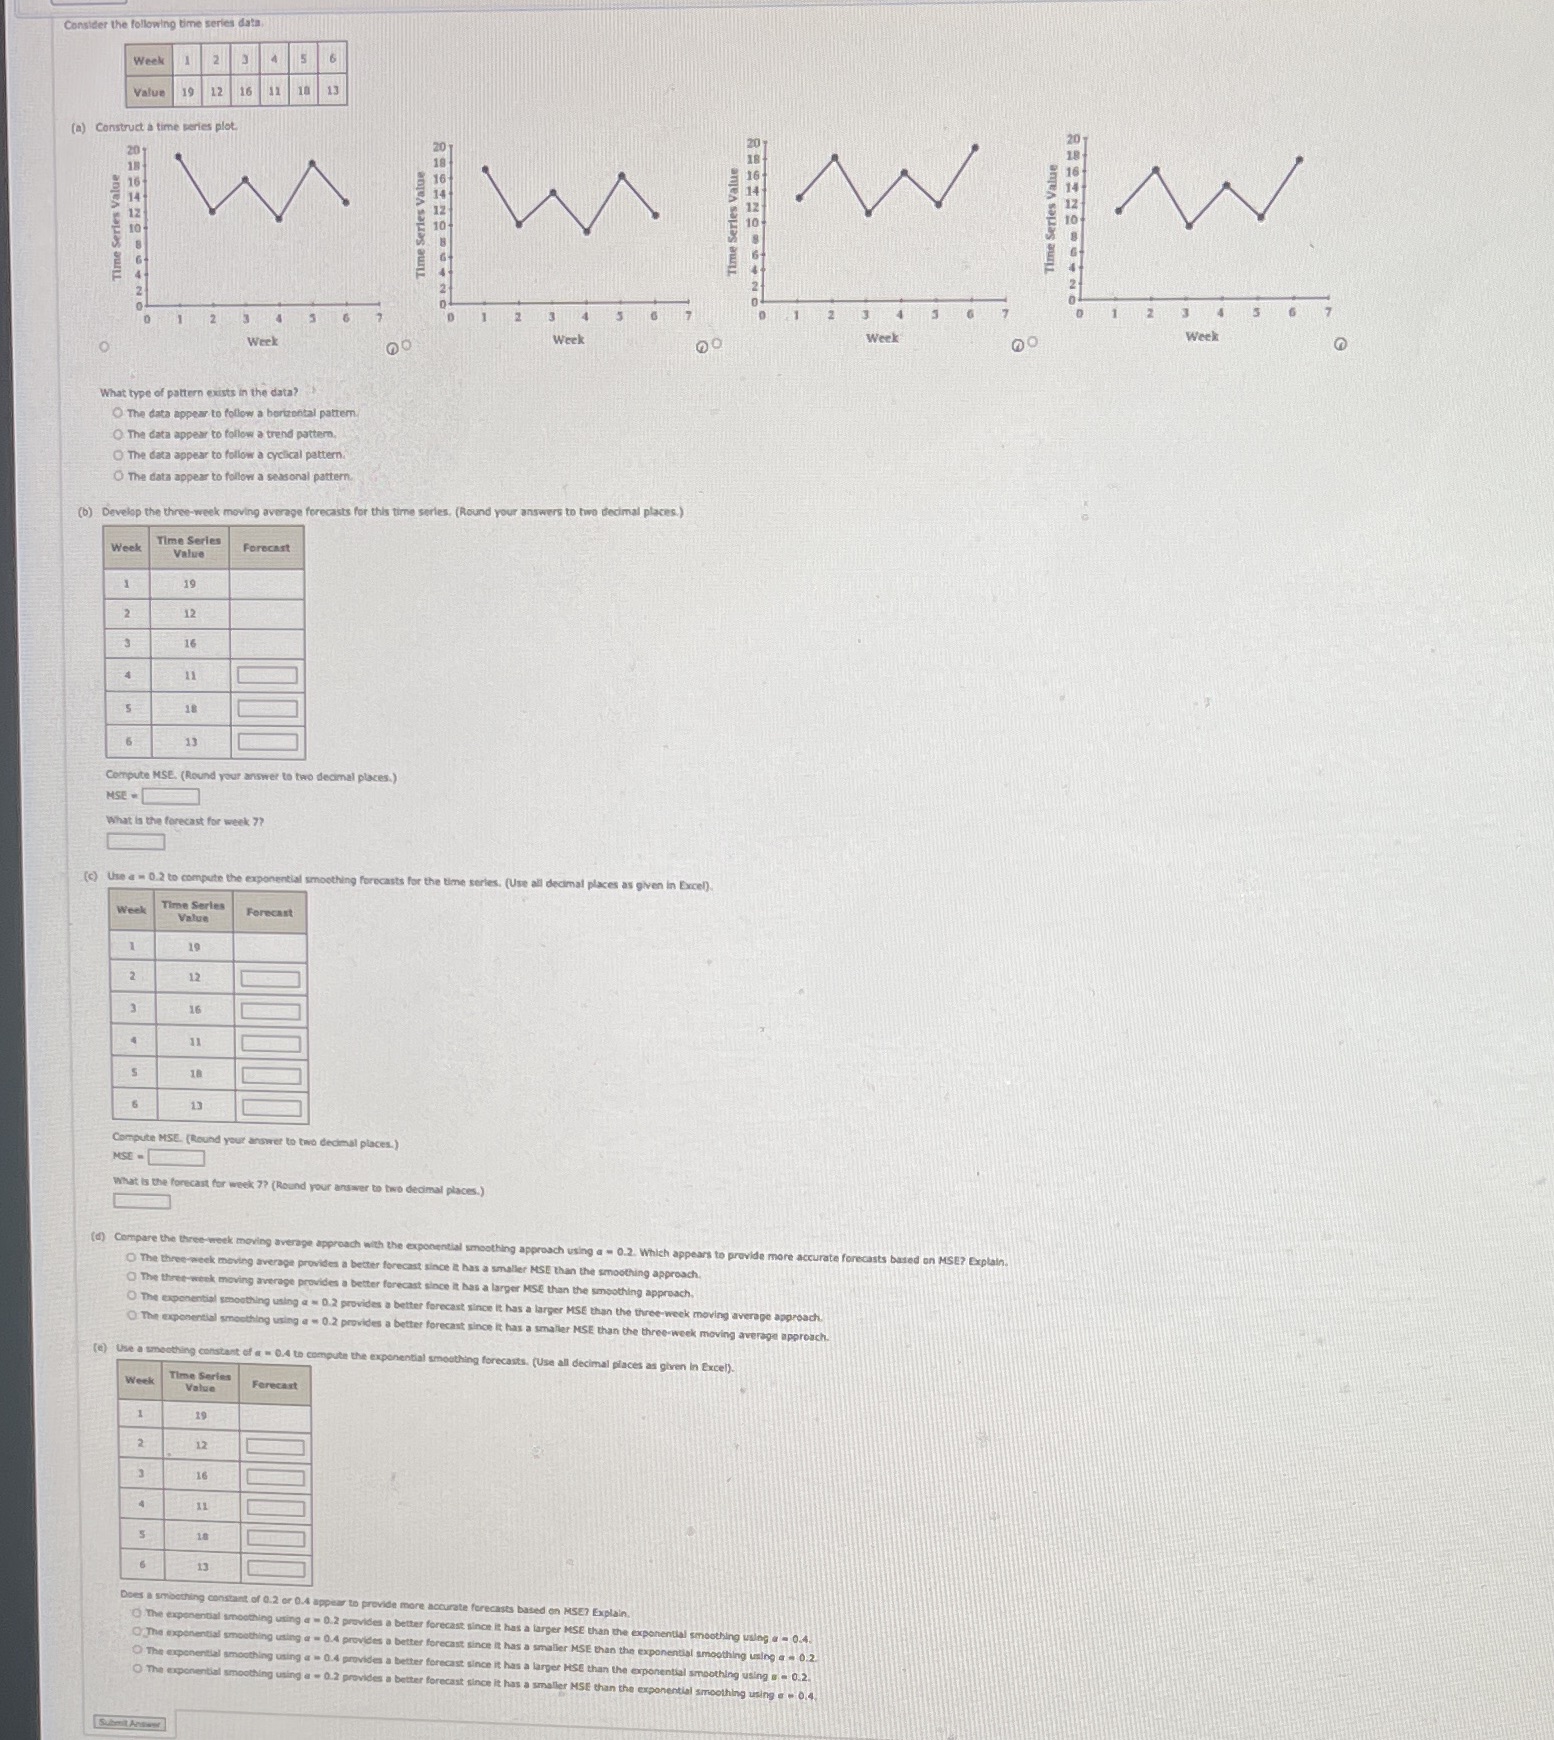
Consider the following time series data. Week 1 2 2 4 5 61 Value 19 12 16 12 18 13 (a) Construct a time beries plot. Time Series Value Time Series Value Time Series Value Time Series Value 2 3 4 Week Week Week What type of pattern exists in the data? O The data appear to follow a horizontal pattern The data appea The data appear to follow a cyclical pattern. The data (b) Develop the three-week moving average forecasts for this time series. (Round your a cimal places. Week Time Series Value Forecast 2 12 16 13 Compute MSE. (Round your answer to two decimal places.) MSE - What is the forecast for week ?? (c) Lise a = 0.2 to compute the expon aries. (Use all decimal places as given in Excel) Week Time Series Value Forecast 19 13 ampute MSE. (Round your answer to two de MSE - what is the forecast for week 7? (Round your answer cimal places.) (d) Compare the th The three re accurate forecasts based on MSE? Explain recast since It has a sma The three week moving average provides a better fore hing approach. O The ex othing approach. othing using a = D.2 provides a OTME recast since It has a larger MSE than the three-week moving average approach. thing using a = 0.2 provides a better ek moving average approach (el) Use a smoothing constant of a = 0.4 to co is as given in excel). Week Time Series Forecast cant of 0.2 or 0.4 ap The expener 9 wing . - 0.4. O The exponer MSE than the ex moothing using a - 0.2. smoothing using a - 0.2. intial smoothing using a - 0.4
Step by Step Solution
There are 3 Steps involved in it

Get step-by-step solutions from verified subject matter experts