

Question: Consider the following two regression lines for stocks A (left) and B (right) in the following figure. Which stock has lower beta and which stock
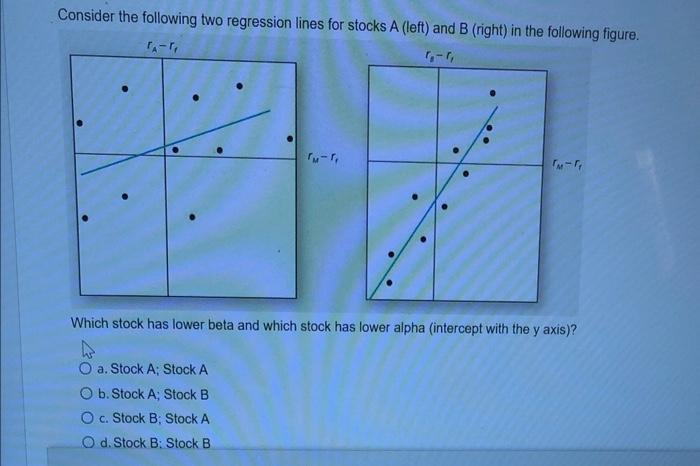
Consider the following two regression lines for stocks A (left) and B (right) in the following figure. Which stock has lower beta and which stock has lower alpha (intercept with the y axis)? a. Stock A; Stock A b. Stock A; Stock B c. Stock B; Stock A d. Stock B: Stock B
Step by Step Solution
There are 3 Steps involved in it
1 Expert Approved Answer
Step: 1 Unlock

Question Has Been Solved by an Expert!
Get step-by-step solutions from verified subject matter experts
Step: 2 Unlock
Step: 3 Unlock