

Question: Consider the graph given below, in which a runner's position is plotted as a function of time. 200 150- (w) x 100- 50- 0
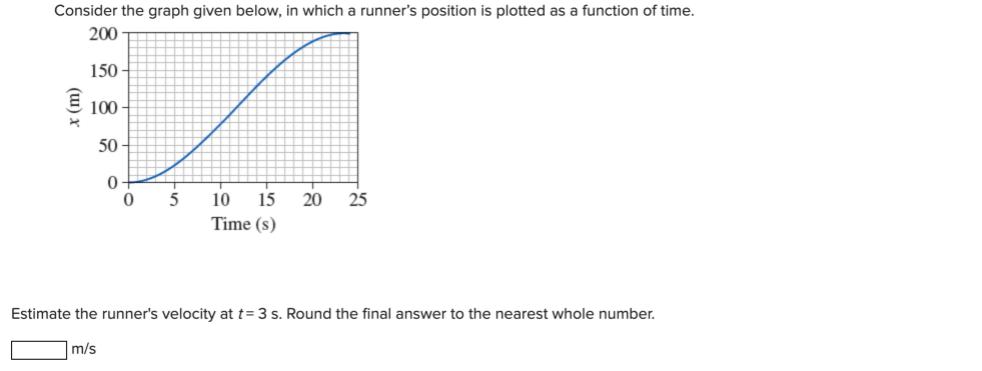
Consider the graph given below, in which a runner's position is plotted as a function of time. 200 150- (w) x 100- 50- 0 0 5 10 15 20 25 Time (s) Estimate the runner's velocity at t=3s. Round the final answer to the nearest whole number. m/s
Step by Step Solution
★★★★★
3.29 Rating (155 Votes )
There are 3 Steps involved in it
1 Expert Approved Answer
Step: 1 Unlock

Solutions Step 1 To estimate the runners velocity at t3 seconds fro... View full answer
Question Has Been Solved by an Expert!
Get step-by-step solutions from verified subject matter experts
Step: 2 Unlock
Step: 3 Unlock