

Question: Draw the influence line for the shear at C. Plot numerical values every 1.5 m. Assume A is fixed and the support at Bis a
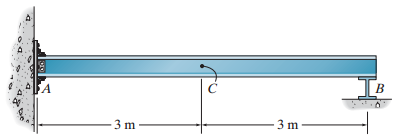
SA B 3 m 3 m
Step by Step Solution
★★★★★
3.51 Rating (161 Votes )
There are 3 Steps involved in it
1 Expert Approved Answer
Step: 1 Unlock

The primary real beam and qualitative influence line ... View full answer
Question Has Been Solved by an Expert!
Get step-by-step solutions from verified subject matter experts
Step: 2 Unlock
Step: 3 Unlock
Document Format (2 attachments)
1589_60619c5af1a6c_677177.pdf
180 KBs PDF File
1589_60619c5af1a6c_677177.docx
120 KBs Word File