

Question: Consider the graph, which shows the effect of a per-unit tax on a market. Which of the following statements is correct? Supply 2 Price ($)
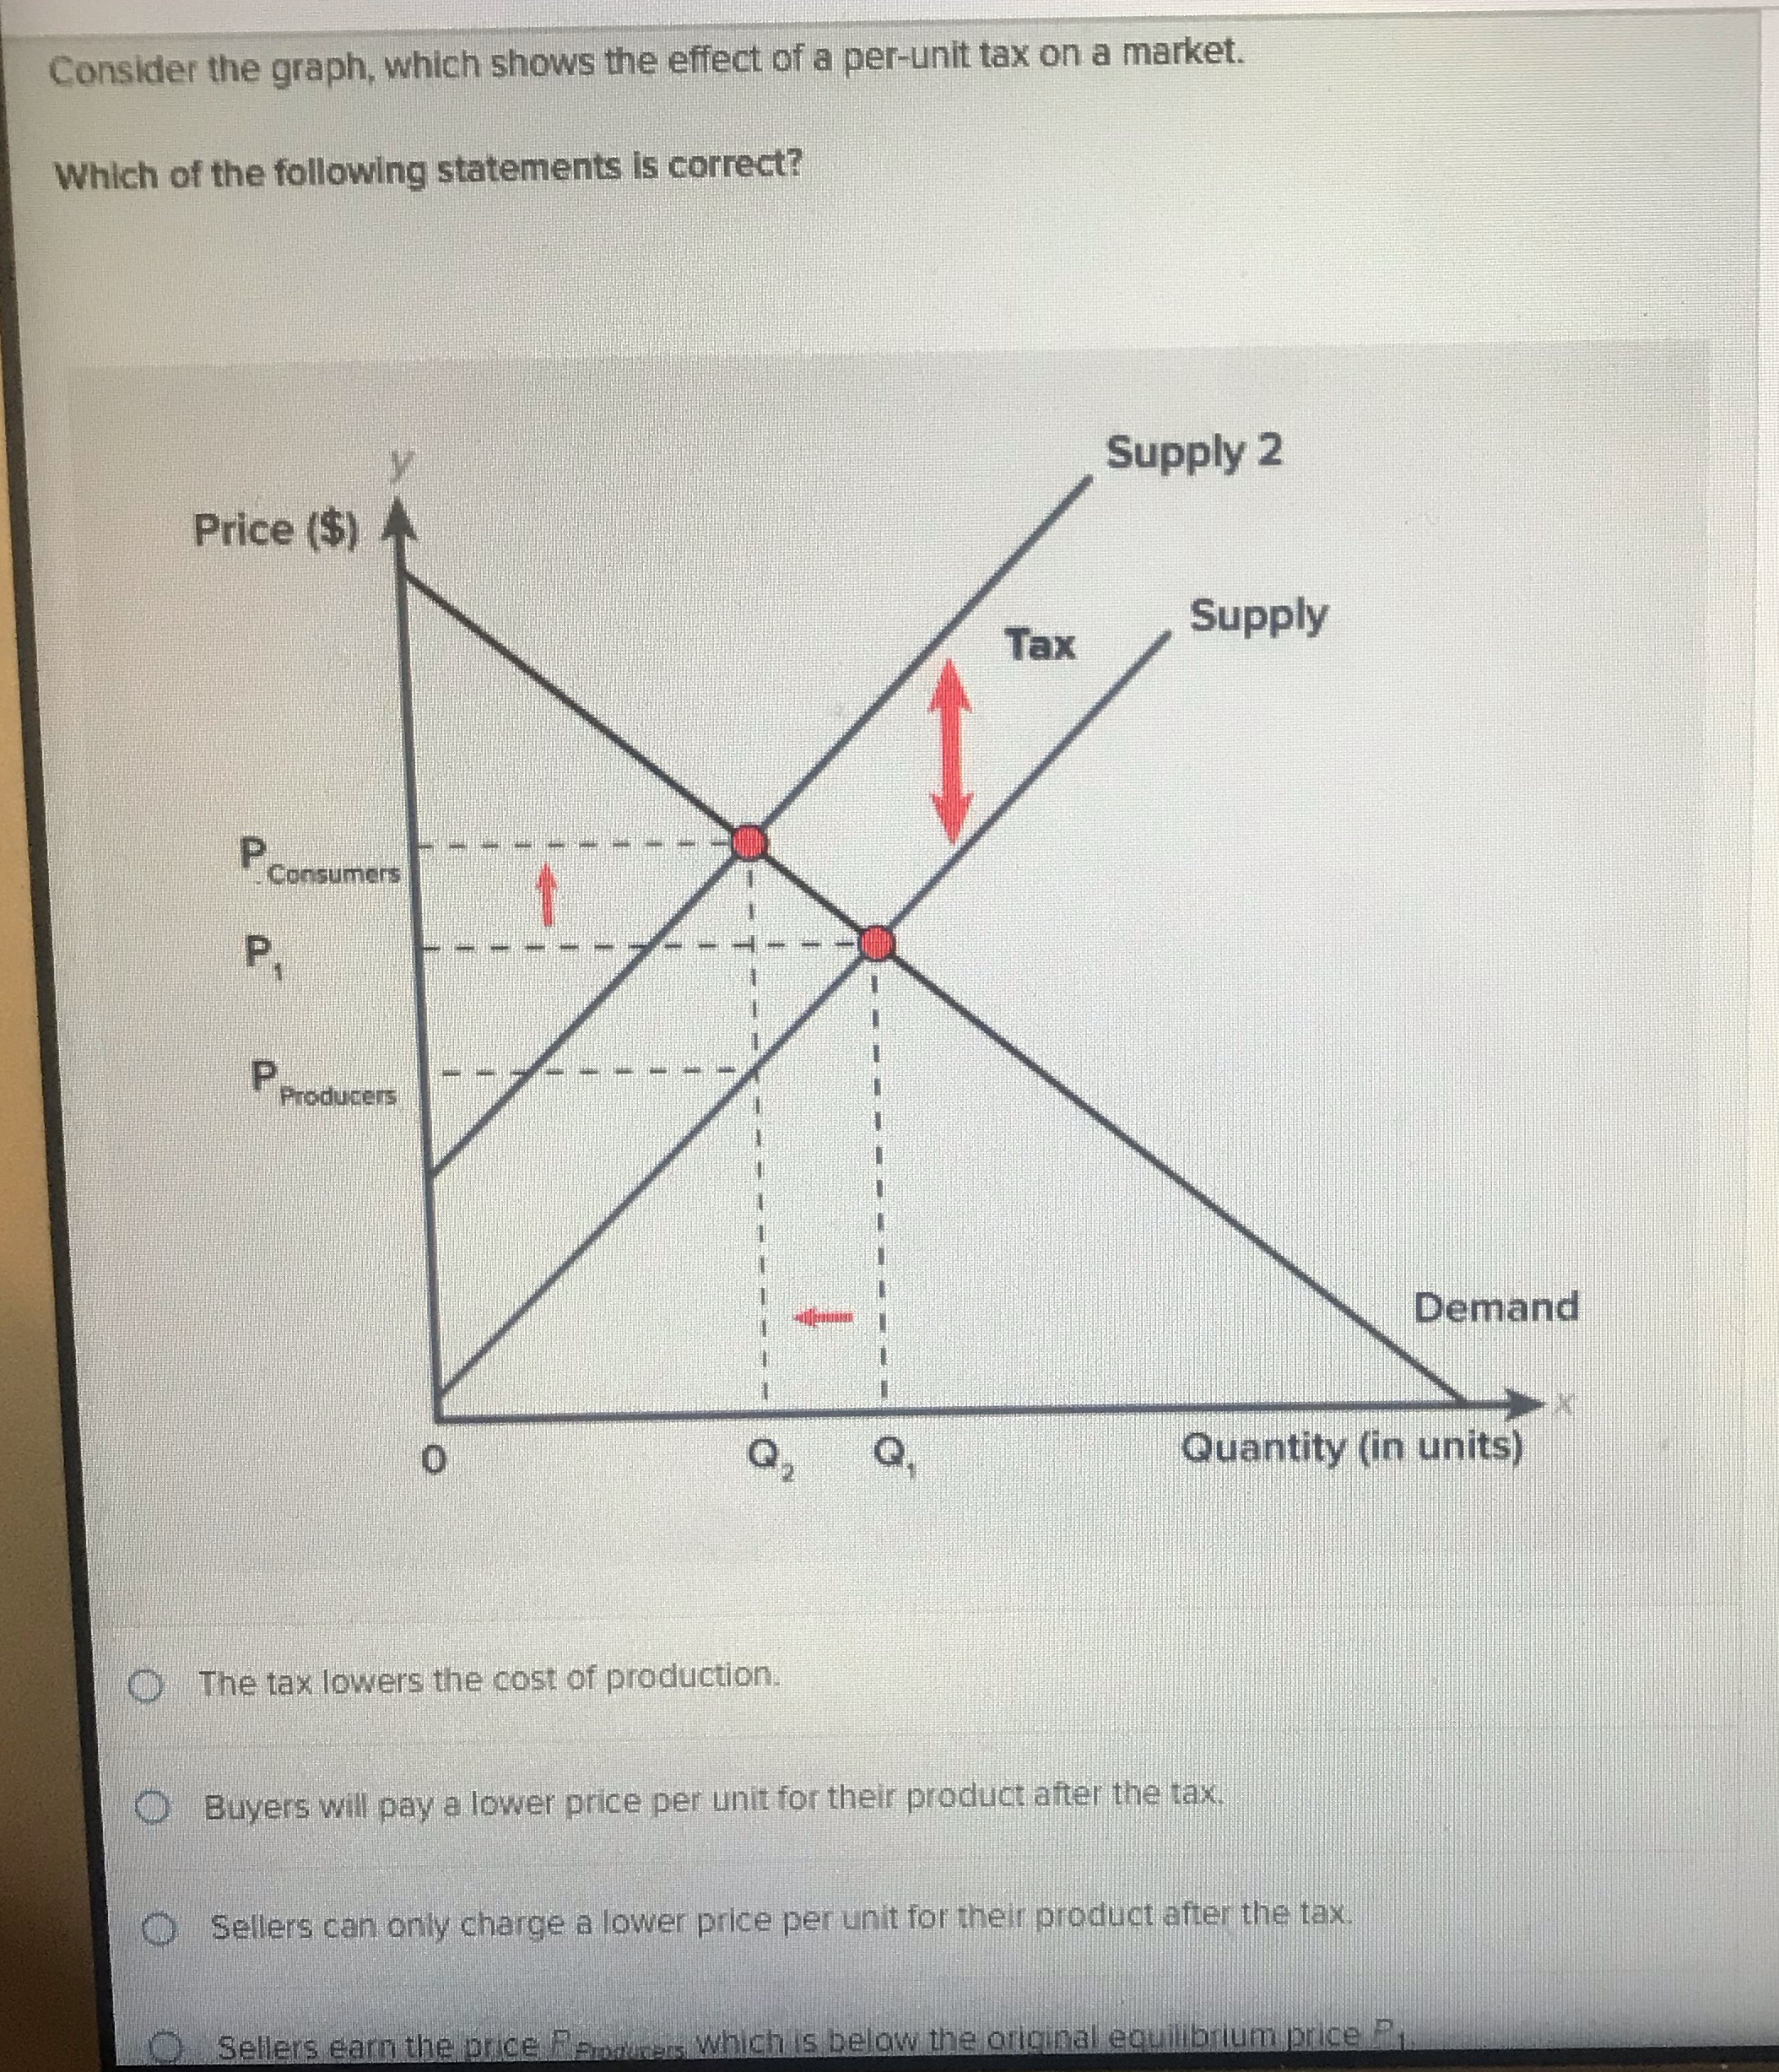
Consider the graph, which shows the effect of a per-unit tax on a market. Which of the following statements is correct? Supply 2 Price ($) Tax Supply consumers P Producers Demand Q, Quantity (in units) The tax lowers the cost of production. O Buyers will pay a lower price per unit for their product after the tax. O Sellers can only charge a lower price per unit for their product after the tax Sellers earn the price hammers which is below the original equilibrium price
Step by Step Solution
There are 3 Steps involved in it
1 Expert Approved Answer
Step: 1 Unlock

Question Has Been Solved by an Expert!
Get step-by-step solutions from verified subject matter experts
Step: 2 Unlock
Step: 3 Unlock