

Question: Consider the market for tablets represented by the graph below. Price $1,200 $1,000 $800 $600 $400 $200 $- 0 100 200 300 400 Quantity
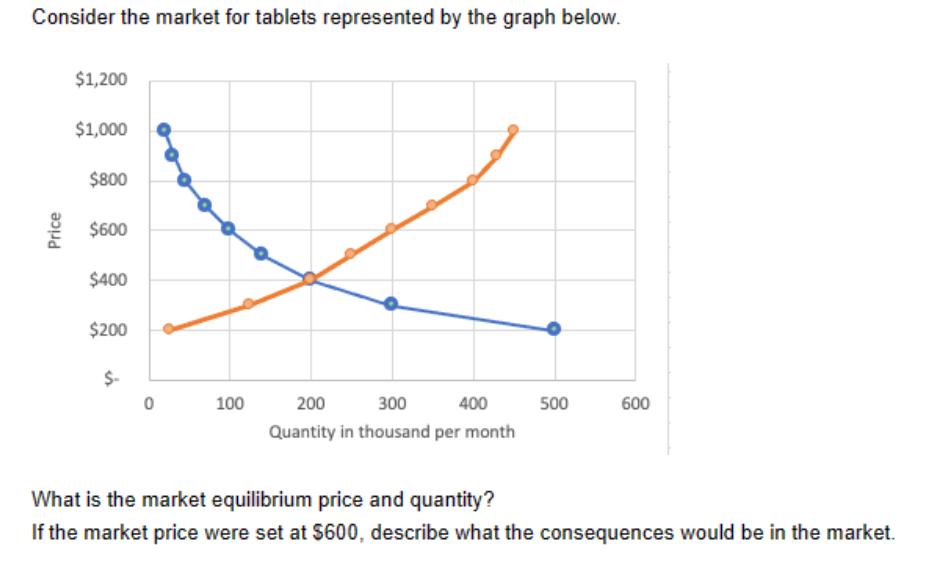
Consider the market for tablets represented by the graph below. Price $1,200 $1,000 $800 $600 $400 $200 $- 0 100 200 300 400 Quantity in thousand per month 500 600 What is the market equilibrium price and quantity? If the market price were set at $600, describe what the consequences would be in the market.
Step by Step Solution
There are 3 Steps involved in it
1 Expert Approved Answer
Step: 1 Unlock

The market equilibrium price is 400 f... View full answer
Question Has Been Solved by an Expert!
Get step-by-step solutions from verified subject matter experts
Step: 2 Unlock
Step: 3 Unlock