

Question: Consider the network in Fig. 1. The normal and crash points for each activity are given in Table D. Compute the minimum different cost- schedules
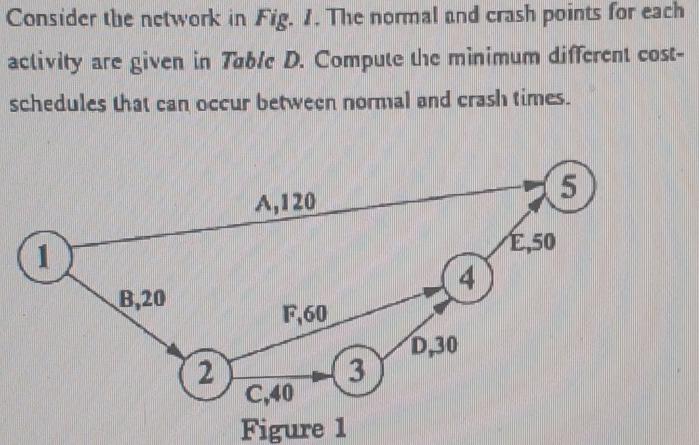
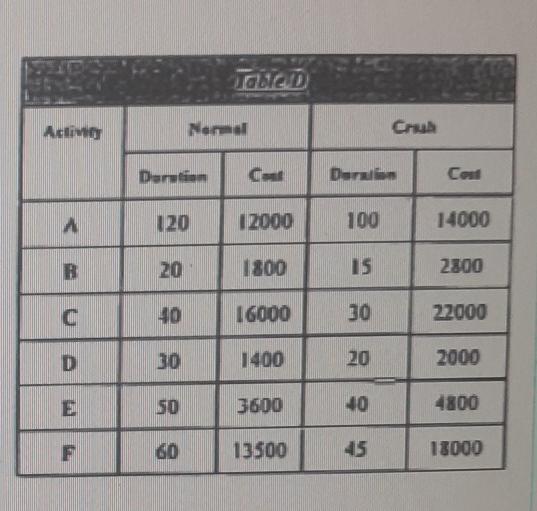
Consider the network in Fig. 1. The normal and crash points for each activity are given in Table D. Compute the minimum different cost- schedules that can occur between normal and crash times. 5 A,120 E,50 1 B,20 7,60 1,30 2 3 0,40 Figure 1 OUD Active Grah Dention G Der Cool A 120 12000 100 14000 B 20 1800 15 2800 C 40 16000 30 22000 D 30 1400 20 2000 50 3600 10 4800 F 80 13500 45 18000
Step by Step Solution
There are 3 Steps involved in it
1 Expert Approved Answer
Step: 1 Unlock

Question Has Been Solved by an Expert!
Get step-by-step solutions from verified subject matter experts
Step: 2 Unlock
Step: 3 Unlock